Playground
The Playground allows you to interact with your live endpoints and provides the ability to compare and evaluate models using your prompt.
The Playground landing screen is shown in Figure 1. The Playground interactive screen, with two model response panes, is shown in Figure 2.
|
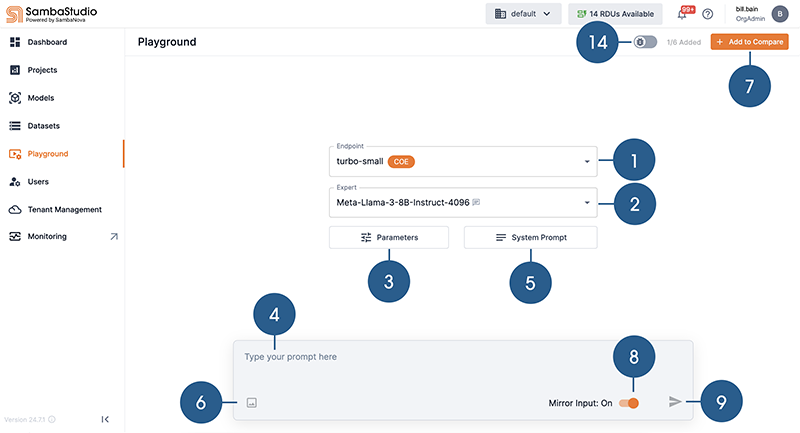
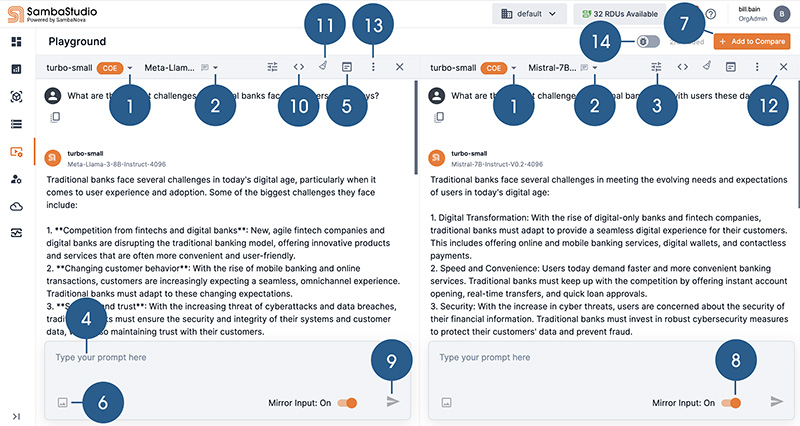
![]() Select a live endpoint to use in the Playground.
Select a live endpoint to use in the Playground.
![]() Select a Composition of Experts (CoE) expert, filter supported prompt type.
Select a Composition of Experts (CoE) expert, filter supported prompt type.
![]() Adjust the Tuning Parameters to maximize the performance and output of the response.
Adjust the Tuning Parameters to maximize the performance and output of the response.
![]() Input a prompt for your selected expert or model.
Input a prompt for your selected expert or model.
![]() Click to access the System Prompt box.
Click to access the System Prompt box.
![]() Click to add an image to your input, if a model supports it.
Click to add an image to your input, if a model supports it.
![]() Add a model response pane. Compare responses to your prompt by adding up to six panes.
Add a model response pane. Compare responses to your prompt by adding up to six panes.
![]() Click to mirror your prompt input across multiple model response panes.
Click to mirror your prompt input across multiple model response panes.
![]() Submit your prompt input to generate a response from the selected experts(s) or model(s).
Submit your prompt input to generate a response from the selected experts(s) or model(s).
![]() Click to access the View Code box.
Click to access the View Code box.
![]() Clear the prompt(s) and response(s) from the dialog box.
Clear the prompt(s) and response(s) from the dialog box.
![]() Click to remove the corresponding model response pane.
Click to remove the corresponding model response pane.
![]() Click to download the results of your inputs in JSON file format.
Click to download the results of your inputs in JSON file format.
![]() Slide to enable Debug mode.
Slide to enable Debug mode.
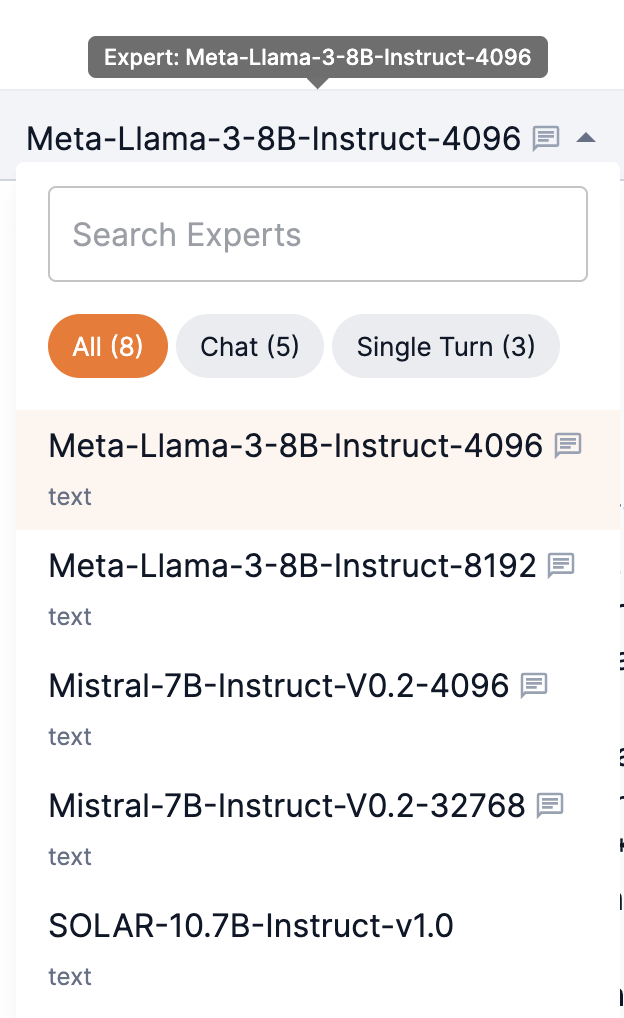
Select a CoE expert
Composition of Experts (CoE) endpoints provide a list of specialized model experts to choose for your task. Additionally, you can choose one of the Samba-1 routers for your task.
-
Select a model expert for your CoE endpoint from the drop-down.
-
Select a Samba-1 router from the drop.
-
Enter a name to quickly locate experts.
-
Filter by Chat or Single Turn prompt types.
-
Chat provides an initial response to your prompt and allows on-going iterative exchanges. For example, prompts are kept within the context of your conversation, with the Playground able to understand your follow-on prompts without the need to restate preceding information.
A chat icon next to the model name indicates that it supports chat functionality.
-
Single Turn provides quick, complete statement responses to a prompt. Single Turn is straightforward and does not require additional context or clarification. Unlike, Chat, follow-on prompts are not kept within the context of previous prompts.
-
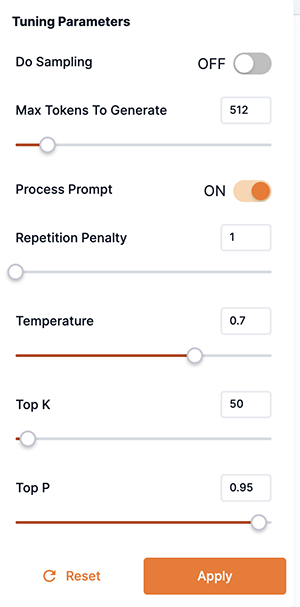
Tuning Parameters
The Playground Tuning Parameters provide additional flexibility and options. Adjusting these parameters allows you to search for the optimal values to maximize the performance and output of the response.
|
Tuning Parameters will not be available in the Playground for OpenAI compatible API endpoints. |
-
Tuning Parameters can be adjusted independently for the selected models in each model response pane of the Playground.
-
Hover over a parameter name to view additional information about it. Click the > (right arrow) to open the Understanding Parameters tuning box to view specific information about your chosen model or expert.
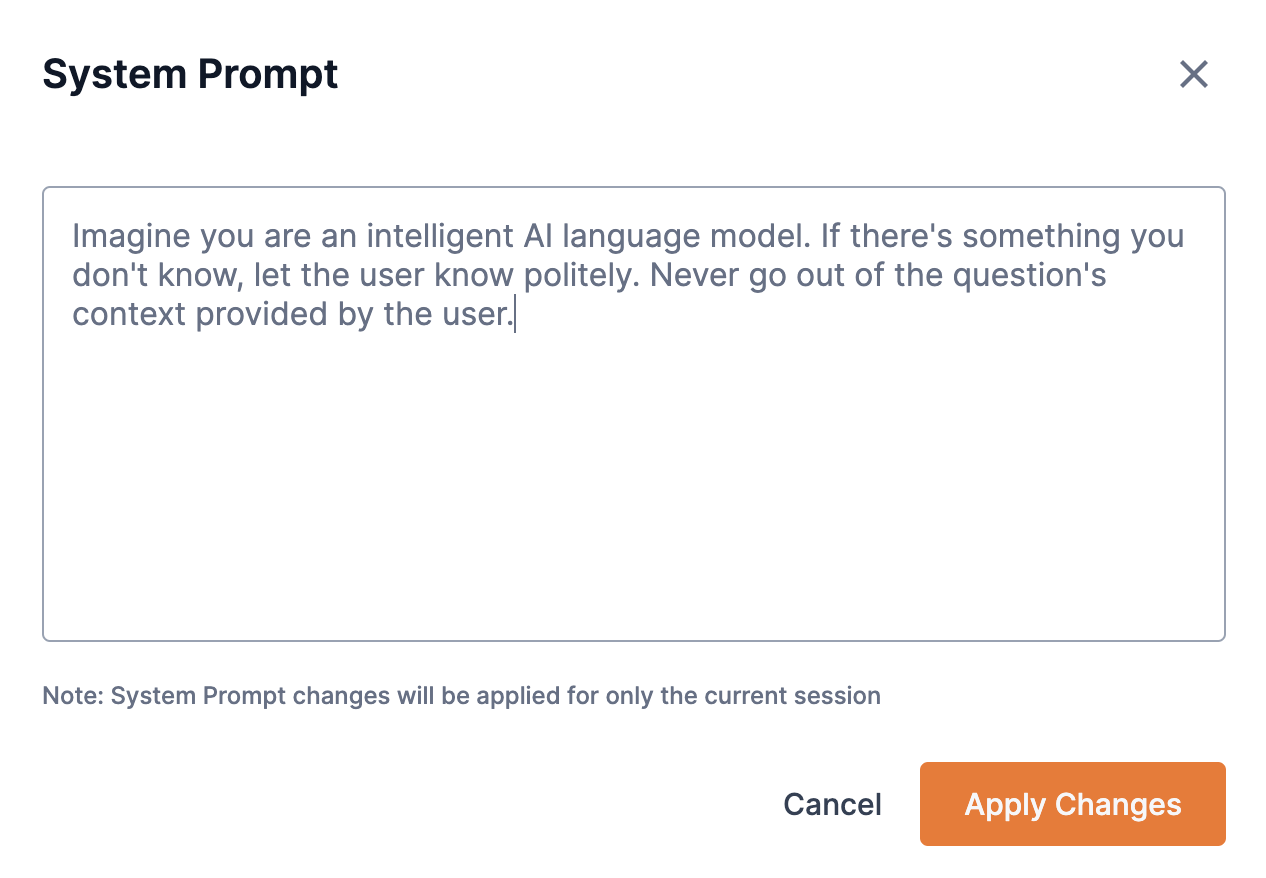
System Prompt
System prompts are unique instruction messages used to steer the behavior of models and their resulting outputs. From the System Prompt box, input your system prompt and click Apply Changes.
-
System prompts can be adjusted independently in each model response pane.
-
For CoE endpoints, the system prompt applies to the selected expert.
-
For non-CoE endpoints, the system prompt applies to the selected endpoint.
-
Edits to the system prompt remain in effect only for your current session. When you log out of the platform, the system prompt will revert to its unedited state.
-
An edited system prompt is denoted by a red dot in the icon (
 in Figure 1 and Figure 2).
Prompt guidelines
We recommend using the following guidelines when submitting prompts to the Playground.
- Prompt structure
-
End the prompts with either a colon (
:), a question mark (?), or another way of letting the model know that it is time for it to start generating. For example, usingPlease summarize the previous article:(with a colon) is a better prompt thanPlease summarize the previous article(without a colon). Adding these annotations tends to lead to better generations as it indicates to the model that you’ve finished your question and are expecting an answer. - Resubmitting prompts
-
Please ensure that you do not submit an
<|endoftext|>token in your prompt. This might happen if you hit submit twice after the model returns its generations.
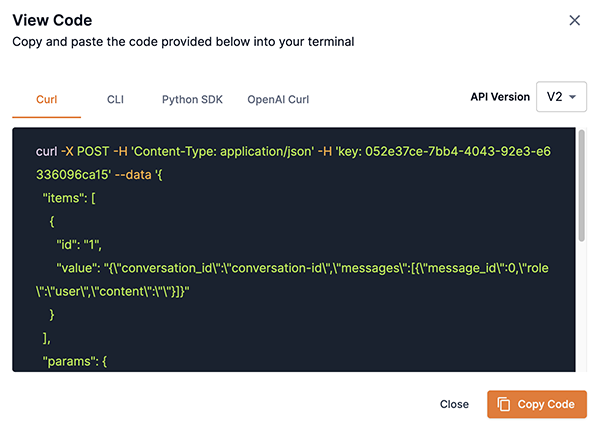
View Code
The View Code box allows you to view and copy the code generated in each model response pane from the current prompt input. You can then make a request programmatically using the copied code.
-
Click the curl, CLI, Python SDK, or OpenAI Curl tab to view the corresponding code block and make a request programmatically.
-
The API Version drop-down allows you to select which API version format to display.
-
-
Click Copy Code to copy the selected code block to your clipboard.
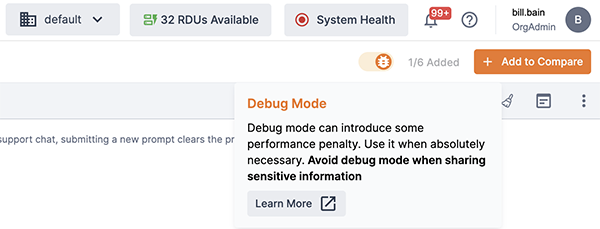
Debug mode
Debug mode is designed to provide users with enhanced visibility into request processing. It helps identify issues, optimize workflows, and improve troubleshooting efficiency. While powerful, the Debug mode requires careful usage to balance functionality with system performance and security considerations.
|
See Detailed logs dashboard for information on the OpenSearch logs platform. |
Considerations
Please be aware of the following considerations when using Debug mode.
- Detailed insights
-
-
Debug mode captures granular details about system operations, including request paths, processing stages, and potential error points.
-
Debug mode generates logs for each enabled request session.
-
- Performance impact
-
-
Enabling Debug mode may have a slight impact on performance, especially on storage utilization and, to some extent, on compute speed.
-
You should activate Debug mode only when necessary to ensure optimal system performance.
-
Ensure sufficient storage and processing capacity is available to handle additional logging during Debug mode.
-
- Data sensitivity
-
-
Debug mode may log sensitive data related to system operations and user requests.
-
You should exercise caution to avoid using Debug mode with sensitive information.
-
Logs generated during Debug mode are stored onto OpenSearch server clusters.
-
- Limited scope
-
-
The logs are accessible only to Owners, Collaborators and Viewers of the endpoints. See Share roles for more information.
-
Currently, logs can only be generated for Samba-1 Turbo endpoints.
-
It’s important to note that debug logs can be complex and may require expertise to interpret effectively. We recommend reaching out to your Site Reliability Engineer Or SambaNova Support for assistance when using this feature to ensure accurate understanding and troubleshooting.
-
Enable Debug mode using the GUI
In the top right corner of the Playground, toggle the slider to the right. The toggle will change from gray to orange.
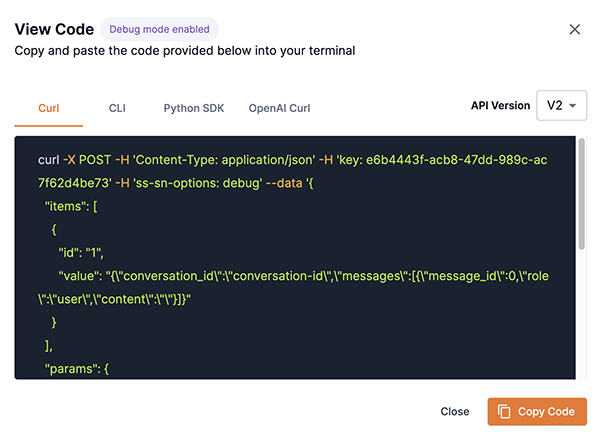
Enable Debug mode via code
Debug mode can be enabled via curl Python SDK, CLI, and OpenAI curl. To view instructions for each method:
-
Select the appropriate Endpoint and Model from the Playground.
-
Enable Debug mode by toggling the slider.
-
Click View Code to open the View Code box. The View Code box will indicate that Debug mode is enabled.
-
The code for enabling Debug mode using curl Python SDK, CLI, and OpenAI curl will be displayed.
Disable Debug mode
Debug mode can be enabled for specific requests. To disable Debug mode, toggle the Debug mode slider to the left once diagnostics are complete.
View Debug mode logs
-
Debug logs can be accessed through the OpenSearch Dashboard.
-
Use the filtering and search features to locate specific events or issues.
Filter logs by correlation ID
-
Errors: If there’s an error in the Playground, the correlation ID will be included in the response. You can use this ID to filter logs accessed via the Endpoint details for detailed insights.
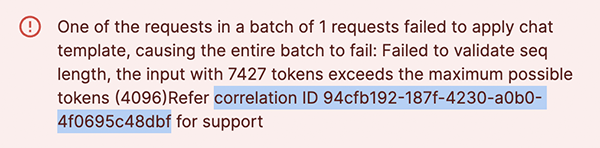 Figure 9. Correlation id
 -
Non-error scenarios: When there’s no error, the correlation ID can be retrieved from the response header x-correlation-id in the network call logs.