Dashboard
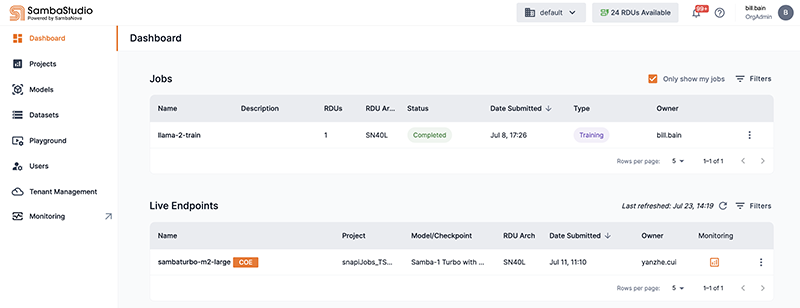
The Dashboard displays user relevant information in an easy-to-digest format. Select the Dashboard icon from the left menu to navigate to the Dashboard window.
Jobs table
The Jobs section aggregates the platform’s job information into a multi-column table. The table can be arranged according to specific data by using the Filters drop-down. You can select a job directly from the table to view its training detail window or batch inference detail window.
The table presents the following information:
-
Name displays the name of the job.
-
Description displays the description of the job, if one was provided.
-
RDUs displays the number of SambaNova Systems' Reconfigurable Dataflow Units™ (RDUs) used by the job.
-
RDU Arch displays the SambaNova hardware generation (SN10, SN30, SN40L) used when the job was created.
-
Status displays the current status of the job.
-
Date Submitted displays the date and time the job was submitted to the platform.
-
Type displays the job type.
-
Owner identifies the owner of the job.
-
Actions provides additional interactions for the job:
-
View Job navigates to the detail window of the selected job. This action is equivalent to directly selecting the job from the jobs table.
-
Delete deletes the job and its associated checkpoints from the platform.
-
Quit stops a job from running in the platform.
-
Live endpoints table
The Live endpoints section displays all endpoints, assigned to all projects, in the selected tenant. The table can be arranged according to specific data by using the Filters drop-down. You can select an endpoint directly from the table to view its detail window.
The table presents the following information:
-
Name displays the name of the endpoint.
-
Project displays the project the endpoint is assigned.
-
Model/Checkpoint displays the associated model or checkpoint of the endpoint.
-
RDU Arch displays the SambaNova hardware generation (SN10, SN30, SN40L) used when the endpoint was created.
-
Date Submitted displays the date and time the endpoint was submitted to the platform.
-
Owner identifies the owner of the endpoint.
-
Monitoring access the Endpoint monitoring dashboard.
-
The three dots drop-down displays View endpoint, which navigates to the detail window of the selected endpoint. This action is equivalent to directly selecting the endpoint from the endpoints table.
