DePlot
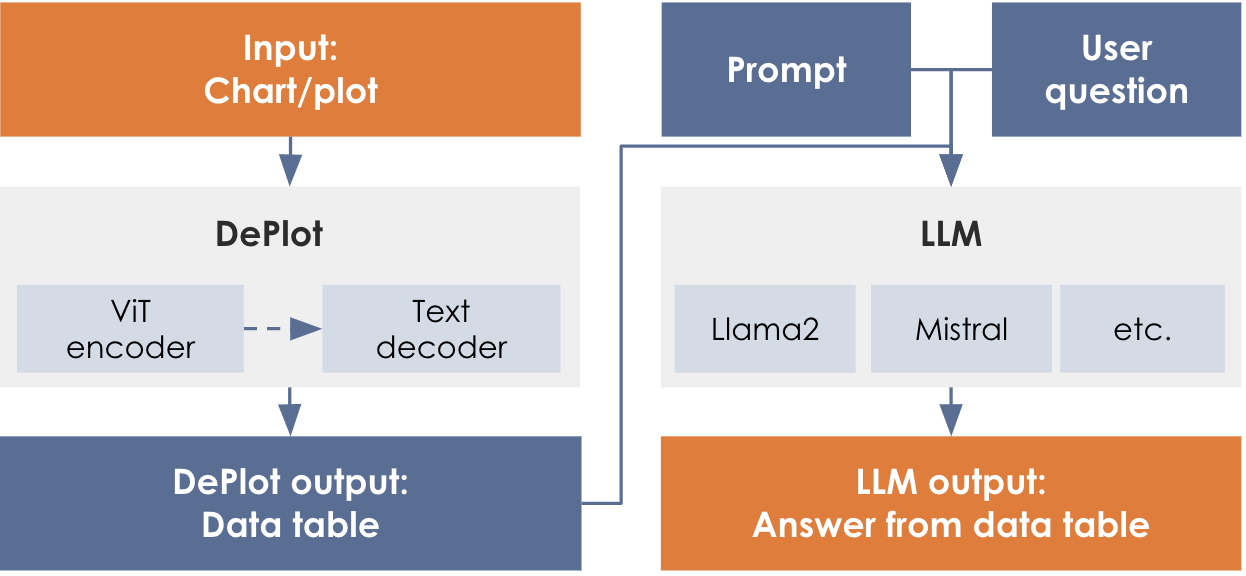
DePlot is a multimodal model for single-shot translation of an input image of a plot/chart to a table as output. The output table from DePlot is linearized as a textual sequence in markdown format, with | separating cells and \n, <0x0A>, or [SEP] separating rows, and generated in the left-to-right convention. For utilizing it in a chart question answering feature, the output table can be used to prompt a LLM of your choice (such as Llama, and others) to interpret values from the table.
![Chart QA Example (arXiv:2212.10505 [cs.CL])](_images/deplot-paper-reference.png)
Output
The output will be text in a markdown tabular format.
Column 1 | Column 2 | Column 3
MEDIAN | value | value
value | value | value
value | value  | value
...TITLE | Title_of_Infographic
Column 1 | Column 2 | Column 3
MEDIAN | value | value
value | value | value
value | value | valueTITLE | Title_of_Infographic
Column 1 | Column 2 | Column 3
value | nan | value
value | value | nanTITLE | Title_of_Infographic
Column 1 | Column 2 | Column 3
value | | value
| value | value|
In some cases, interpolating the missing values led to improved quality of the response from the downstream LLM for ChartQA applications. This, however, may only work for certain use cases. Another consideration for ChartQA applications is the structural nature of the response from DePlot. Filling in the blank spaces in the DePlot response with explicit NaNs helped the qualitative result of the ChartQA in many cases. |
Hyperparameters and settings
The hyperparameters and settings for DePlot are described below.
| Parameter | Definition | Allowed values | User Adjustable |
|---|---|---|---|
|
The maximum number of tokens in a sequence that is being processed by the model. The sequence length, in this case, is the sum of the number of tokens input to the model and the number of tokens generated by the model (max_new_tokens). |
512 |
No |
|
The maximum number of tokens for the model to generate in its output. You can use this parameter to limit the response to a certain a number of tokens. The generation will stop either when the model stops generating due to </s> or reaches the limit for max tokens to generate. The default value for max_new_tokens is 512. |
1 < = Integer < = 512 |
Yes, via a POST method to endpoint |
|
Make sure the total number of tokens in your prompt plus the value you set for max_new_tokens does not exceed the sequence length of the model. For instance, if you input is 256 tokens, then max_new_tokens cannot be set to more than 256 since the total would be greater than 512 (sequence length of the model). NOTE: An error may not be thrown if this total sequence length is exceed; however, it is likely that the model’s output will be truncated at (sequence_length - input_length) tokens. |
Deploy a DePlot endpoint
Follow the steps below to deploy an endpoint using DePlot.
|
See Create a non-CoE endpoint using the GUI for detailed information about creating and deploying endpoints. |
-
Create a new project or use an existing one.
-
From a project window, click New endpoint. The Add an endpoint box will open.
-
Select the following settings to create the endpoint:
-
Select DePlot from the ML App drop-down.
-
Select DePlot from the Select model drop-down.
-
-
Click Add an endpoint to deploy the endpoint.
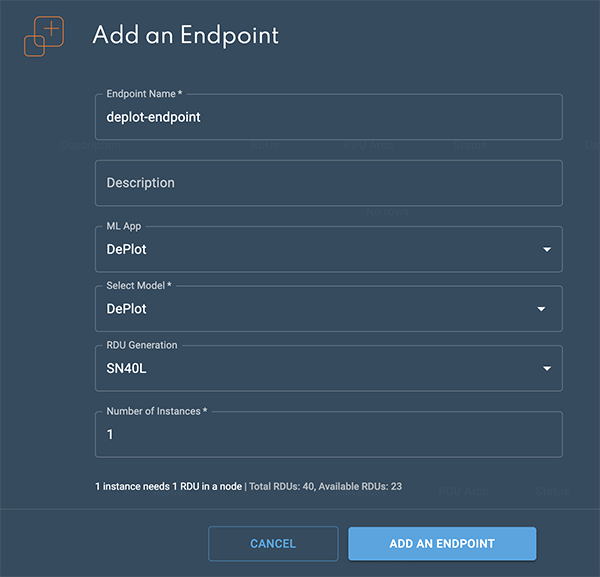 Figure 3. Add an endpoint box
 -
The Endpoint created confirmation will display.
-
Click View endpoint to open the endpoint details window.
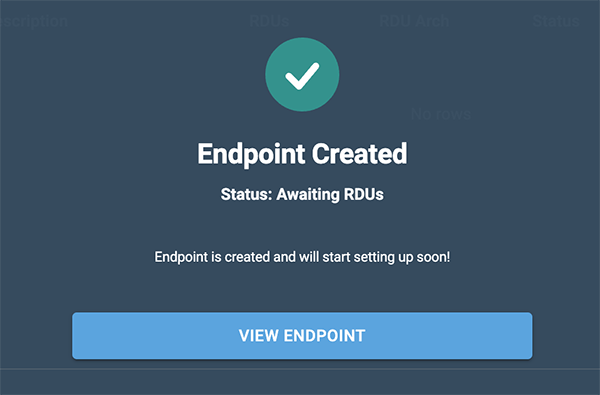 Figure 4. Endpoint confirmation
 -
The status will change to Live in a few minutes when the endpoint is ready.
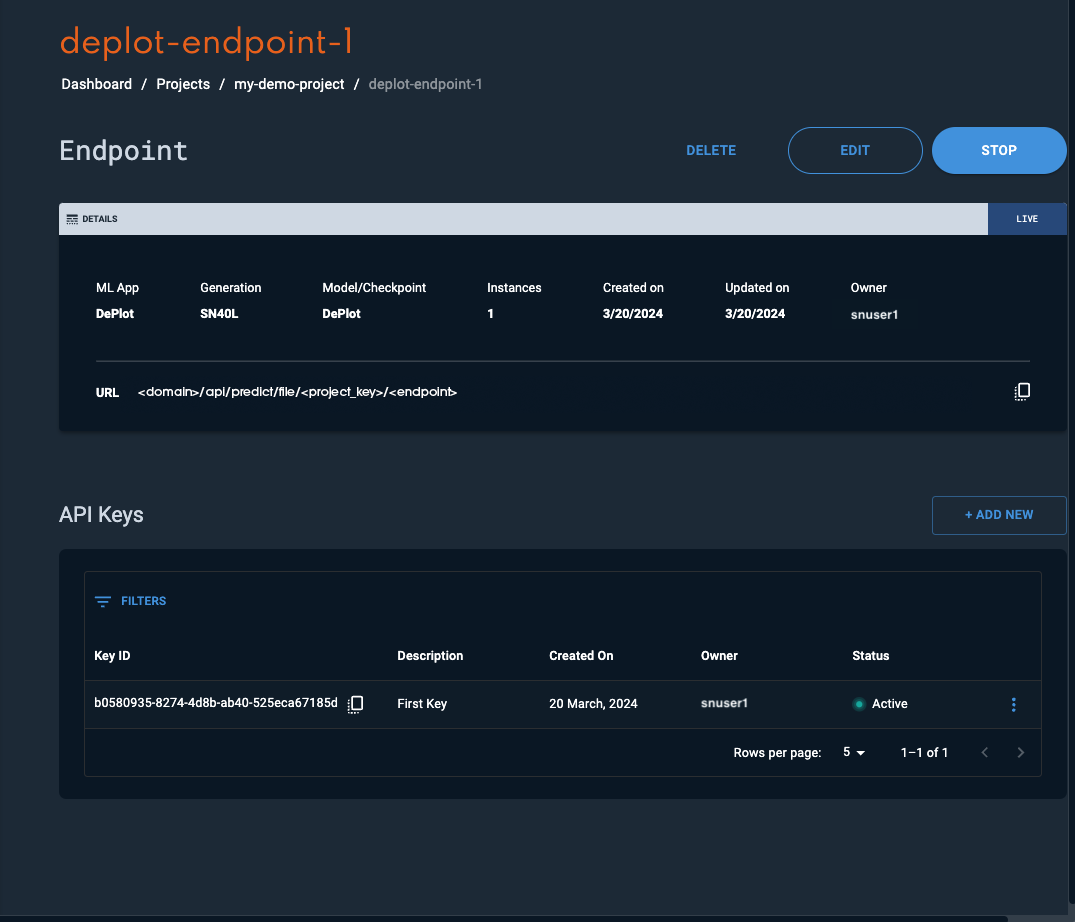
Please refer to the Usage section for instructions on how to interact with the endpoint.
Usage
Once the endpoint has been created in SambaStudio, you can interact with it as described below. The example curl request template below demonstrates the basic curl format. The following attributes are specified in the example curl request template:
-
<endpoint key>is the endpoint API key. The endpoint API Key can be viewed in the Endpoint window. -
<bytes>is the content of the image, serialized into bytes, and encoded in base64 format into a string. You can use the following bash command can get the encoded string.-
Bash command:
IMG_DATA=$(cat "$IMAGE_PATH" | base64)
-
-
<endpoint URL>describes the path to the endpoint. The endpoint URL can be viewed in the Endpoint window.
curl -X POST -H 'Content-Type: application/json' -H 'key: <endpoint key>' --data '{"instances":["<bytes>"],"params":{"max_new_tokens":{"type":"int","value":"512"}}}' '<endpoint URL>'Encode the image to base64
The image input will first need to be encoded to a base64 format string before it can be passed in as an input to the API. As there are several different ways to accomplish this, we have provided an example of how you can manage the construction of your entire input request via an optional bash script.
-
Create a bash script to convert an image file into a base64 string, specify the input prompt, and hyperparameter settings.
On your local computer, create a file named
create-deplot-input-request.shwith the below content to convert all required input request to a text file.-
IMG_DATA=$(cat "$1" | base64)encodes the input image into the base64 format. -
'{"instances" …. "max_new_tokens":{"type":"float","value":"512"}}}'is the request body as described in the example request template.Bash script templateIMG_DATA=$(cat "$1" | base64) echo '{"instances":["'"$IMG_DATA"'"], "params":{"max_new_tokens":{"type":"int","value":"512"}}' > ./<Output-File-Name>
-
-
Run the script to generate the input request text file capturing the entire input request as a JSON object.
-
From your local terminal, run the following command while passing in the image file in either JPG or PNG format.
bash create-deplot-input-request.sh <input-image-file-name> -
Upon completion, you will see the generated input request file for DePlot at your specified location. When viewing it, you will see the image data (
$IMG_DATA) has been encoded into a long string of characters as part of the input request.
-
-
Submit the curl command with the input request to get DePlot’s response.
-
<endpoint key>is the endpoint API key. The endpoint API Key can be viewed in the Endpoint window. -
<endpoint URL>describes the path to the endpoint. The endpoint URL can be viewed in the Endpoint window. -
--data @/input.txtpasses the request body defined in the text file (.txt) as input data when making the API call.Example curl commandcurl -X POST -H 'Content-Type: application/json' -H 'key: <endpoint key>' --data @/input.txt <endpoint URL>Example JSON API return{"status":{"complete":true,"exitCode":0,"elapsedTime":0.5004196166992188,"message":"","progress":1,"progressMessage":"","reason":""},"predictions":["TITLE | Share of children who are wasted, 2010\nCountry | Share of children who are wasted, 2010\nHaiti | 1.0\nLibya | 5.32\nMorocco | 5.11\nLebanon | 4.5\nColombia | 1.45"]}
-