Section report
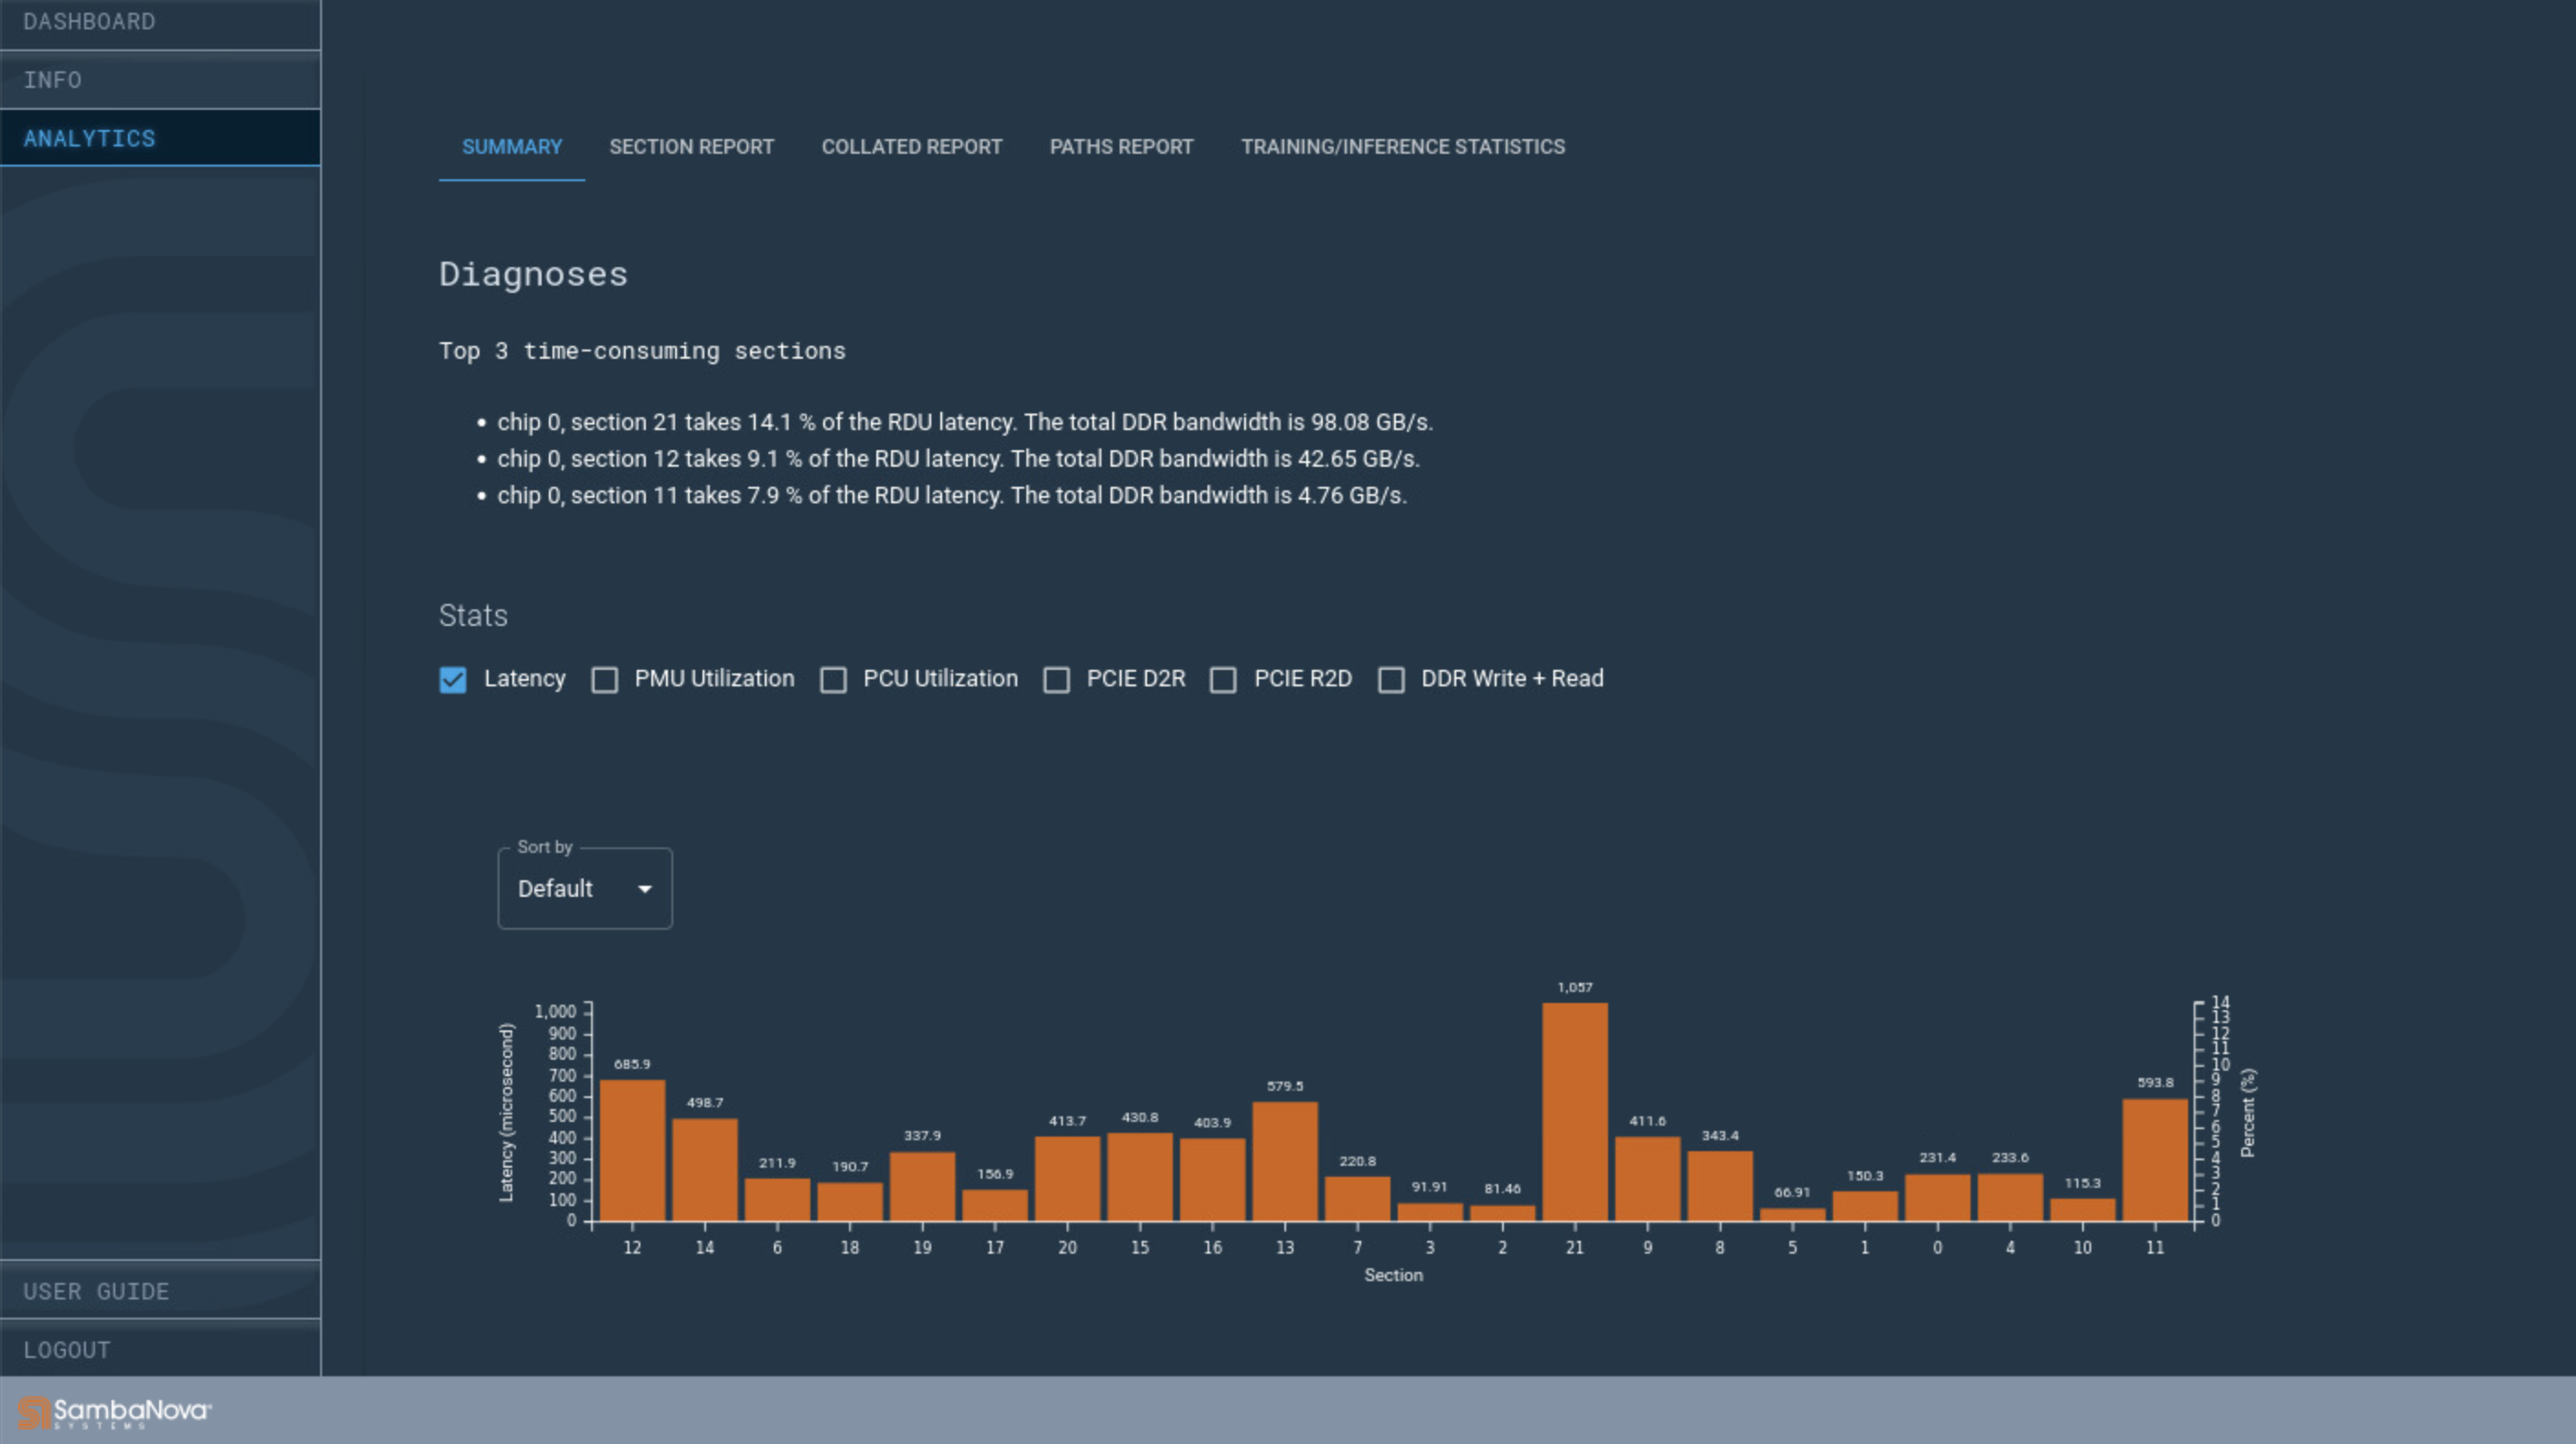
An ML graph is split into sections and each section is run on an RDU. This report provides per-section diagnostics - it lists the time taken by each section, the resources (PCU, PMU) used by each section and the bandwidth of data transferred in and out for each section (DDR, PCIe).

Locate the report
Output data in CSV format are in
/reports/section_report.csv in your output directory.
Understand the output data
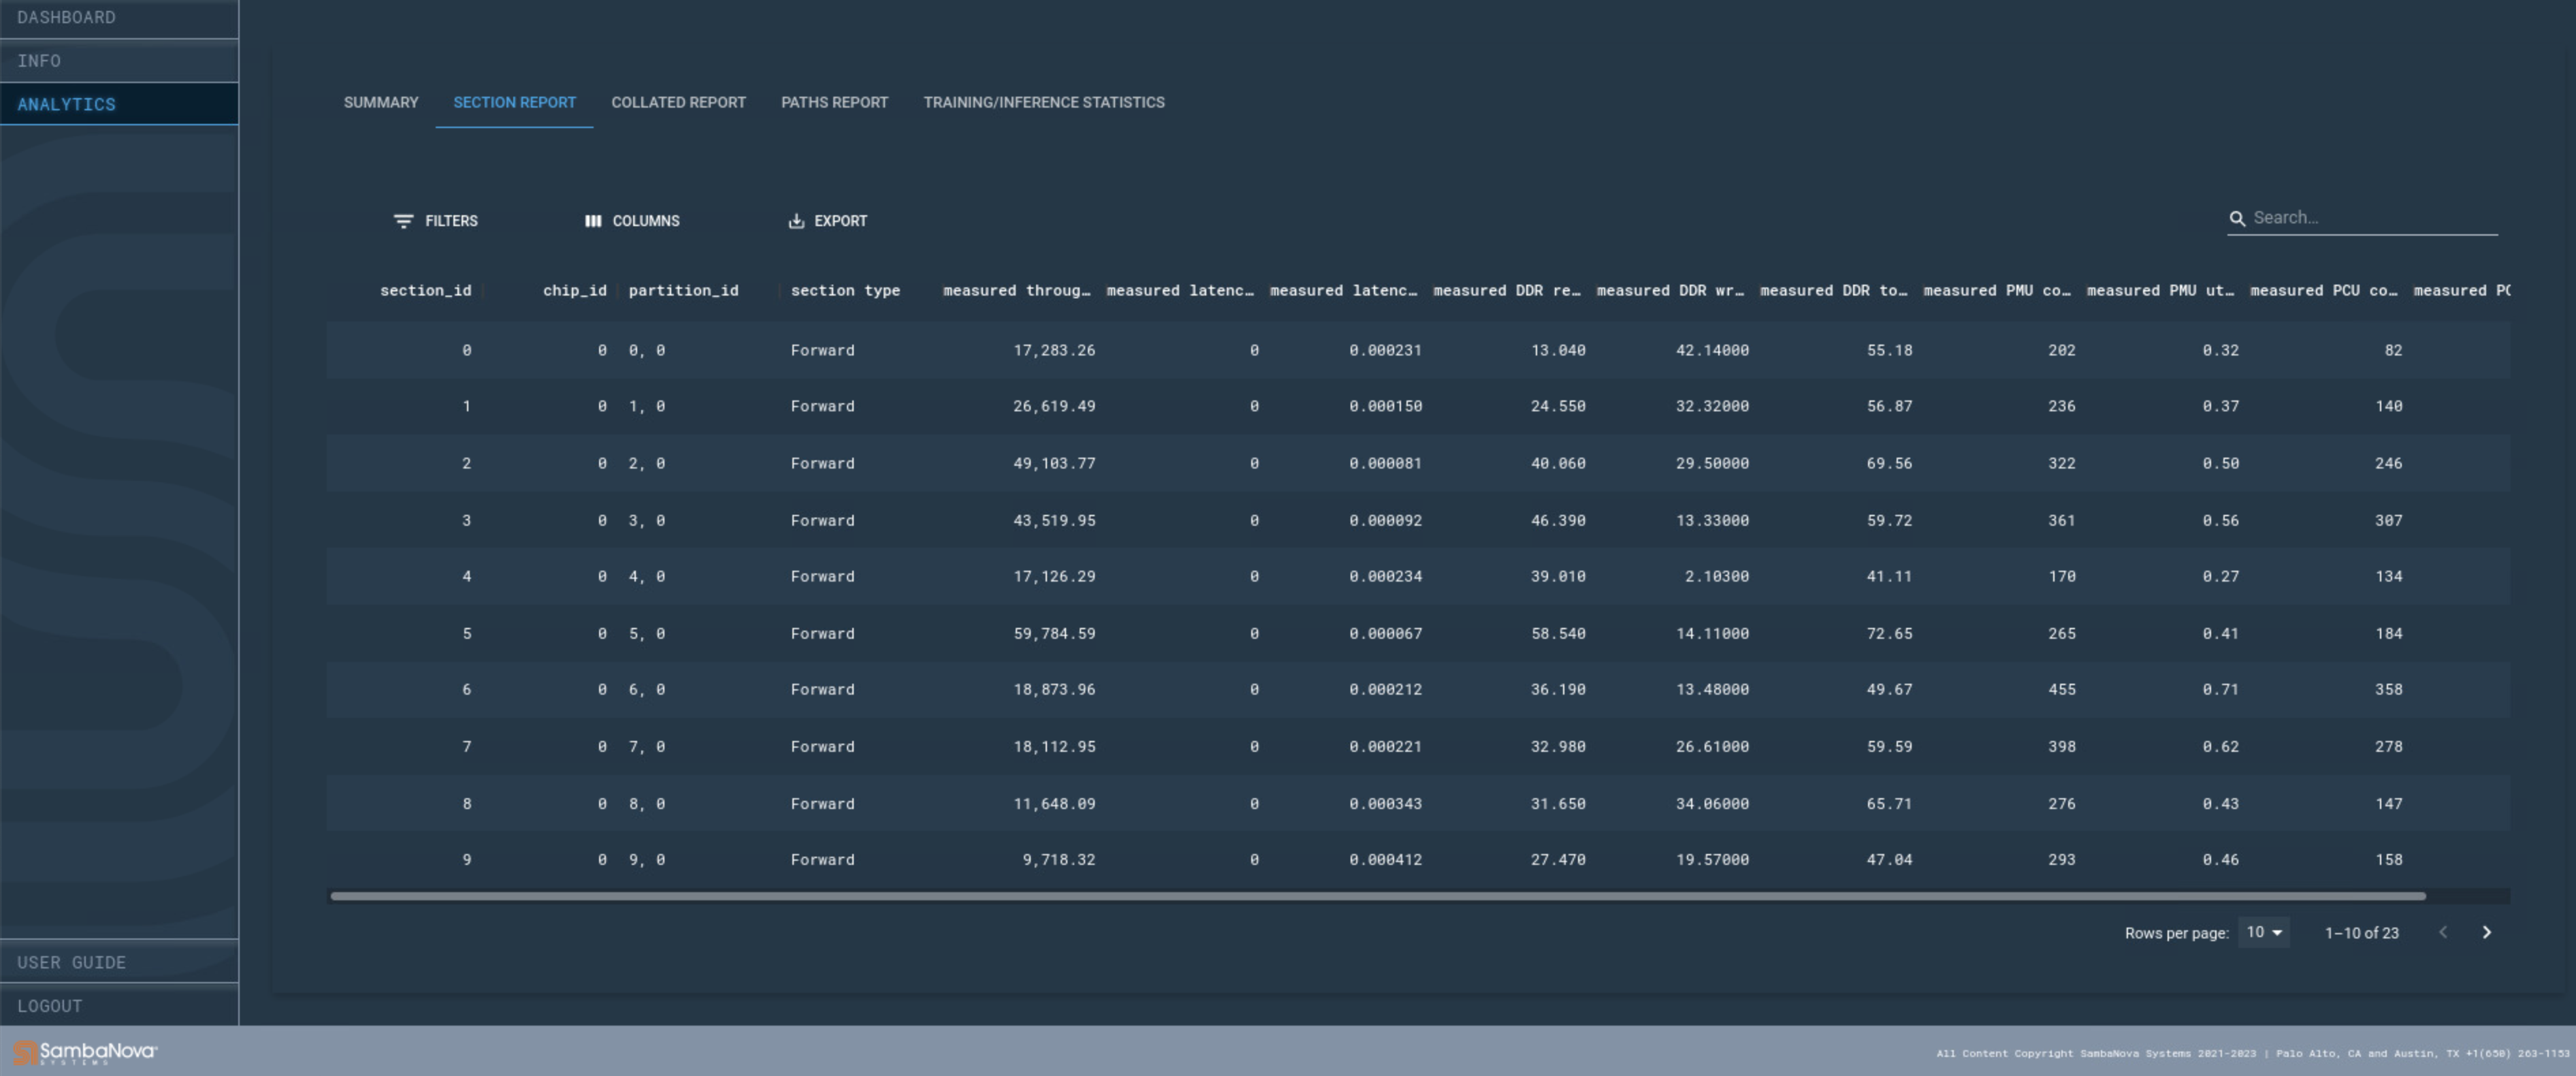
The complete report has multiple fields, each of which are explained below.
| Column name | Description |
|---|---|
section_id |
ID of the section. |
chip_id |
ID of the RDU on which the section executed. |
partition_id |
The (section_id, chip_id) tuple. |
section type |
Type of the section: Forward, Backward or Optimizer. |
measured throughput, samples/s |
Throughput of the section measured while running the section. |
measured latency (cycles) |
Latency in cycles of the section measured while running the section. |
measured latency (sec) |
Latency in seconds of the section measured while running the section. |
measured DDR read BW, GB/s |
DDR read bandwidth of the section measured while running the section. |
measured DDR write BW, GB/s |
DDR write bandwidth of the section measured while running the section. |
measured DDR total BW, GB/s |
DDR read and write bandwidth of the section measured whilte running the section. |
measured PMU count |
Actual number of PMUs allocated to the section. |
measured PMU utilization |
PMUs used in the section as a percentage of PMUs available in the RDU. |
measured PCU count |
Actual number of PCUs allocated to the section. |
measured PCU utilization |
PCUs used in the section as a percenatge of PCUs available in the RDU. |
Interpret the data
Reading the section report can help you identify performance hotspots within and across sections. For example, if Section 4 shows the longest latency, consider troubleshooting other aspects of Section 4, and investigate if Section 4 was DDR Bandwidth bound, resource bound or simply too congested.
Example output
Here is an example report
| section_id | chip_id | partition_id | section type | measured throughput, samples/s | measured latency (cycles) | measured latency (sec) | measured PMU count | measured PMU utilization | measured PCU count | measured PCU utilization |
|---|---|---|---|---|---|---|---|---|---|---|
0 |
0 |
0, 0 |
Forward |
4,697,247.71 |
130,960 |
0.000109 |
22 |
0.03 |
33 |
0.05 |
1 |
0 |
1, 0 |
Backward |
4,697,247.71 |
129,895 |
0.000109 |
58 |
0.09 |
90 |
0.14 |
2 |
0 |
2, 0 |
Optimizer |
4,096,000.00 |
150,065 |
0.000125 |
26 |
0.04 |
8 |
0.01 |
End2End |
167,774.26 |
410,920 |
0.003052 |