Host-device breakdown report
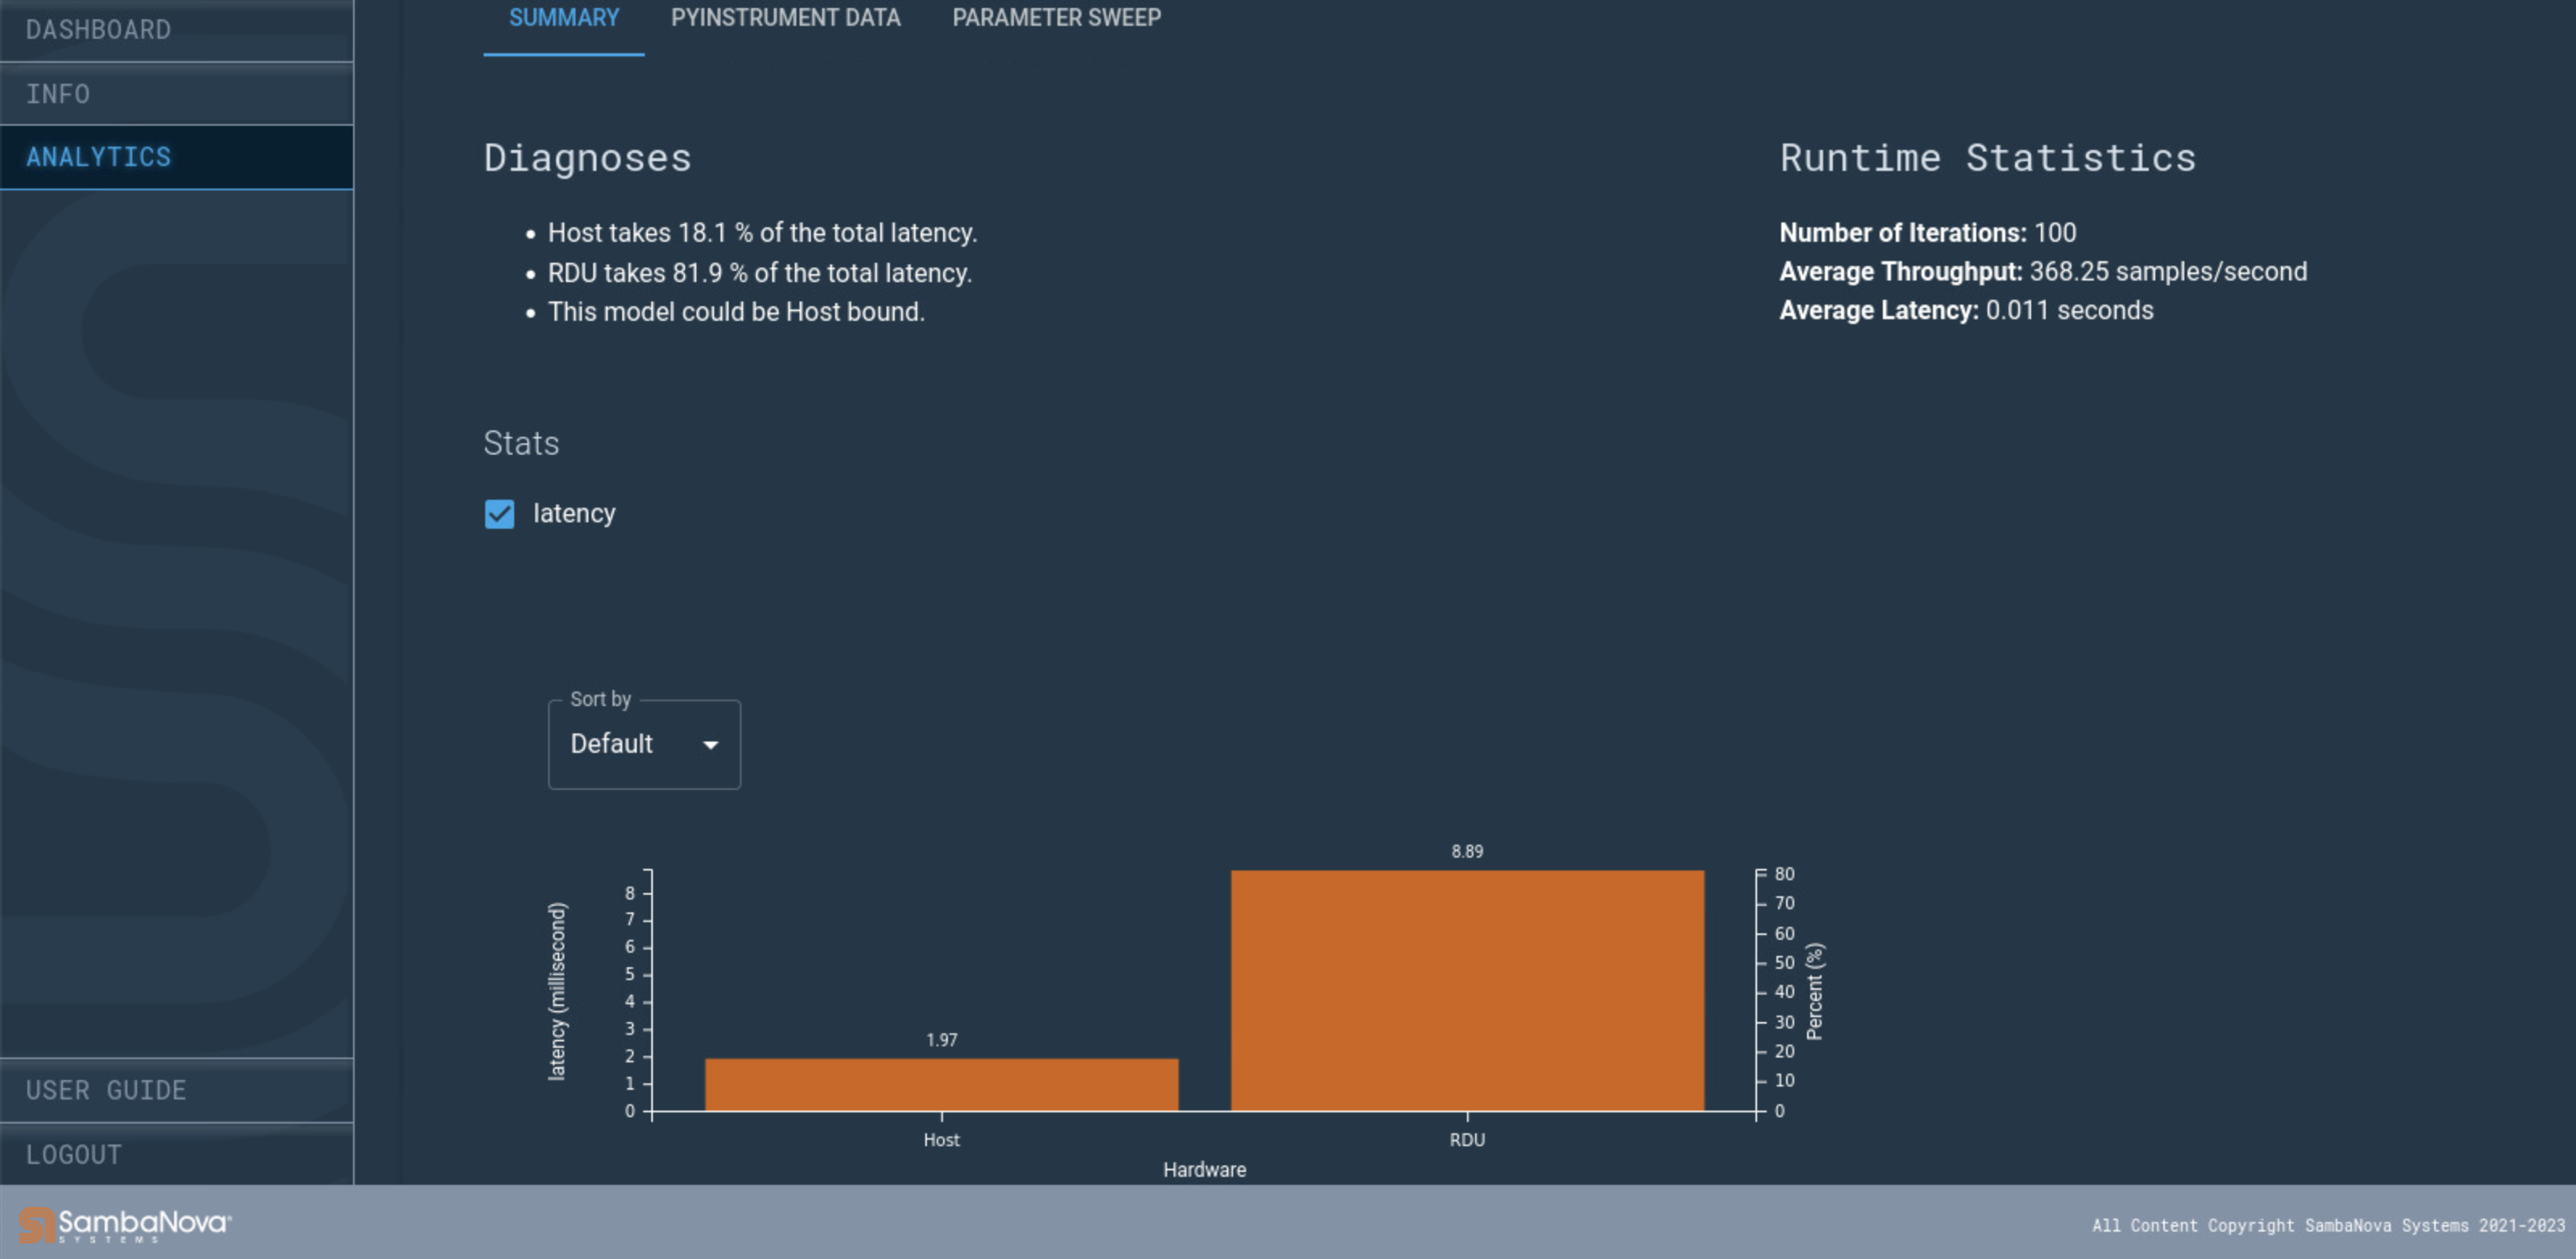
The SambaTune host-device report summarizes latency between the host and the RDU. You can examine the time spent on different host processes and compare those times with time spent on the RDU.
Locate the report
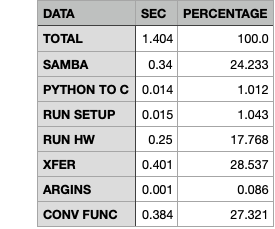
Output data in JSON and CSV format are in the /reports/snprof/summary.csv directory in your output directory.
Read the output data
| Column name | Description |
|---|---|
TOTAL |
End-to-end application time, excluding context setup and teardown. |
SAMBA |
Time spent in Samba application layer. |
PYTHON TO C |
Time spent in Python to C translation. |
RUN SETUP |
Time spent to prepare the graph run or model run. |
RUN HW |
Time spent in hardware to run the graph. |
XFER |
Time spent in runtime and hardware for tensor transfer. |
ARGINS |
Time spent in runtime and hardware for argument transfer. |
CONV FUNC |
Time spent in host conversion function. |
Interpret the data
When you examine the SambaTune output:
-
Look at the percentage for each part of the run.
-
Compare the % for RUN HW with the rest of the run to understand whether your run is bound by the host or by the RDU.
Here’s what you can do next:
-
If the run spends a large percentage of time in RUN HW (99.13% in the example), then the run is RDU bound. Examine the Section Report to view the breakdown of latencies across the sections in the graph.
-
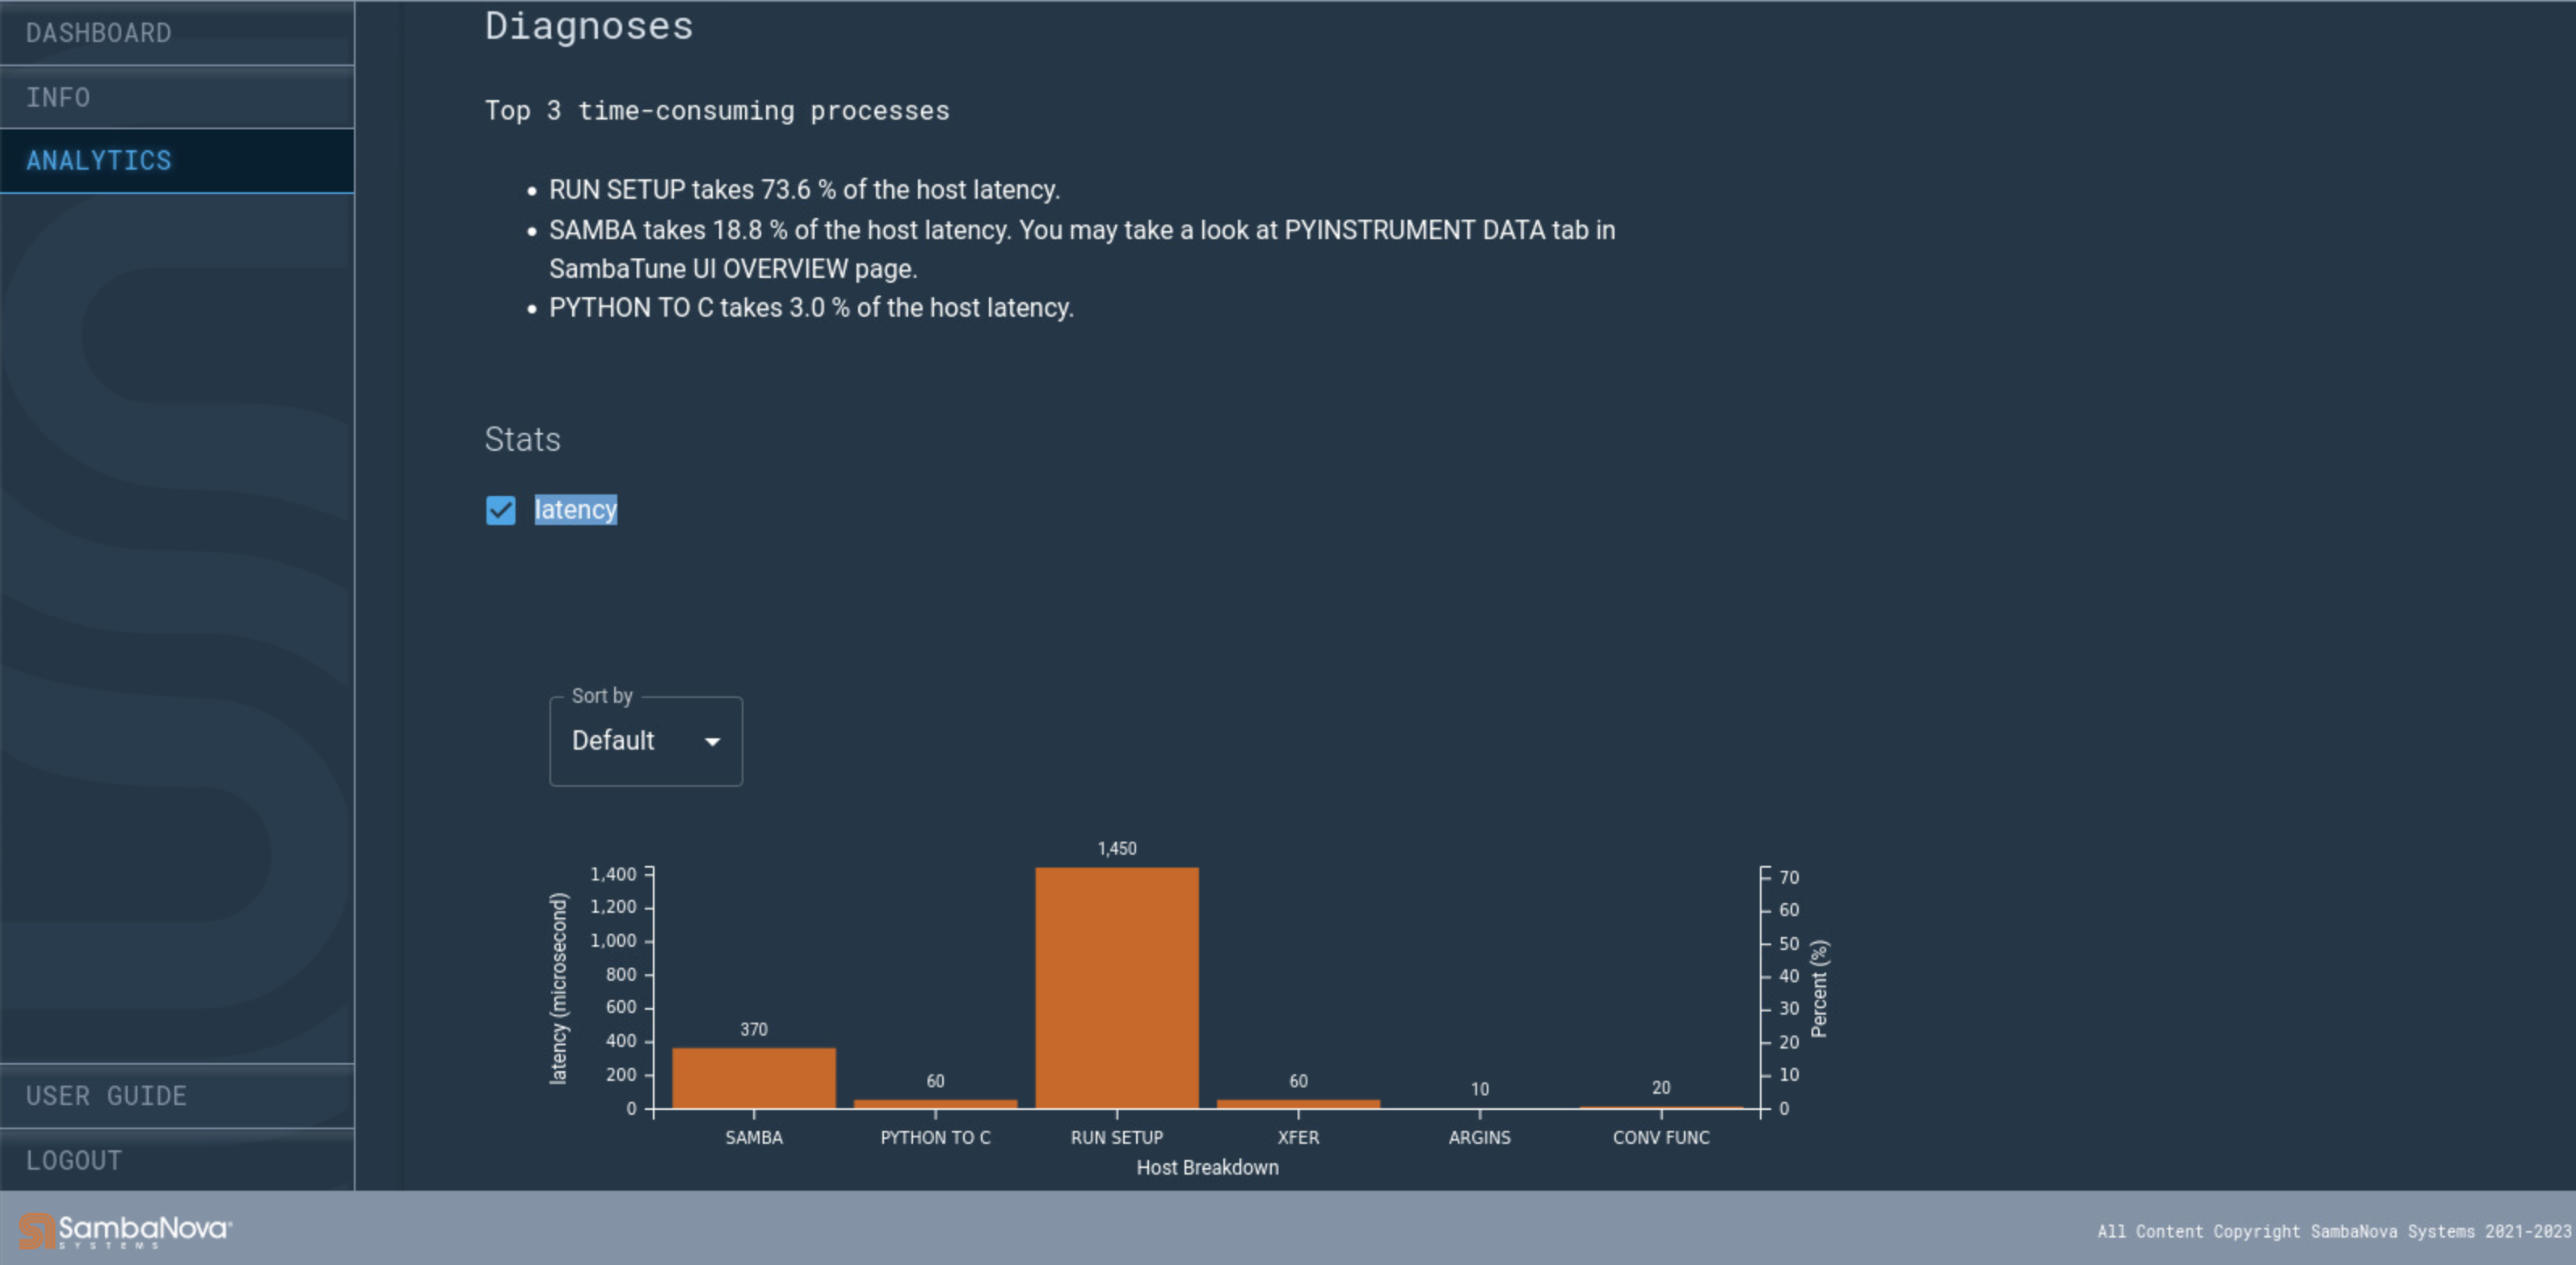
If the run spends 5-20% of time on the host and the remaining time on the RDU, the workload is mildly to moderately host-bound. Examine the host latency profile to understand what step in the host is contributing significantly to the host time.
Example output
Here is an example of the output:
| Breakdown | Time in nsec | Time in sec | Percentage |
|---|---|---|---|
TOTAL |
32148064851.76 |
32.15 |
100 |
SAMBA |
93064851.76 |
0.09 |
0.29 |
PYTHON TO C |
11059759 |
0.01 |
0.03 |
RUN SETUP |
123753560 |
0.12 |
0.38 |
RUN HW |
31867292494 |
31.87 |
99.13 |
XFER |
7459136 |
0.01 |
0.02 |
ARGINS |
43156925 |
0.04 |
0.13 |
CONV FUNC |
2278126 |
0 |
0.01 |