Workflow overview
To use SambaTune for performance optimization and troubleshooting, you follow an iterative process of exploration, code changes, and re-running your model.
Top-level tuning process
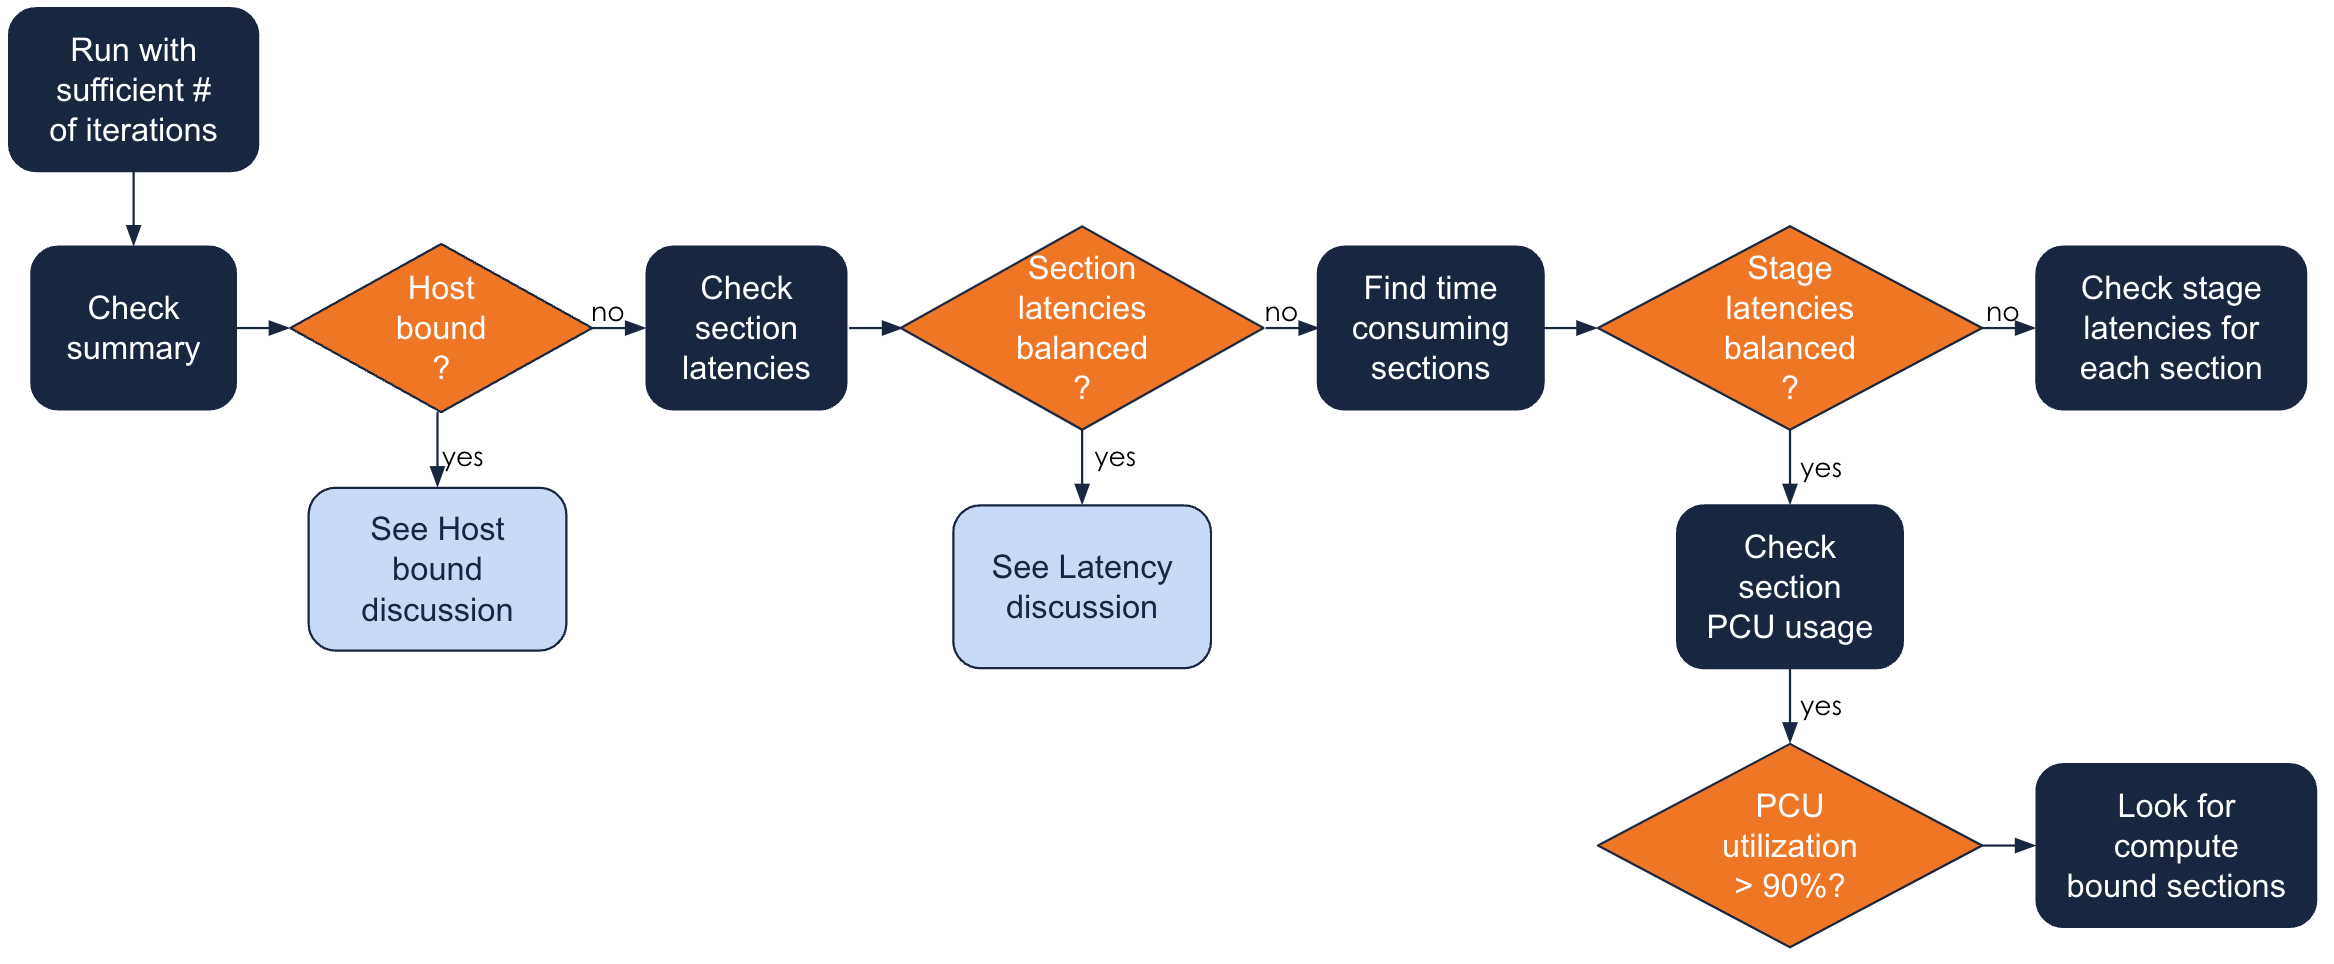
Here’s the detail you need:
| No. | Description | Screenshot |
|---|---|---|
0 |
Start by running your model with a sufficient number of iterations. Ideally, you run the model at least 10 times, but for a model that takes a long time to run, weigh the time required against the time. |
|
1 |
Select Analytics and check the graph in the Summary tab if the model is host bound. If it is, go on to the Host-bound discussion (Optimize host-bound models). |

|
2 |
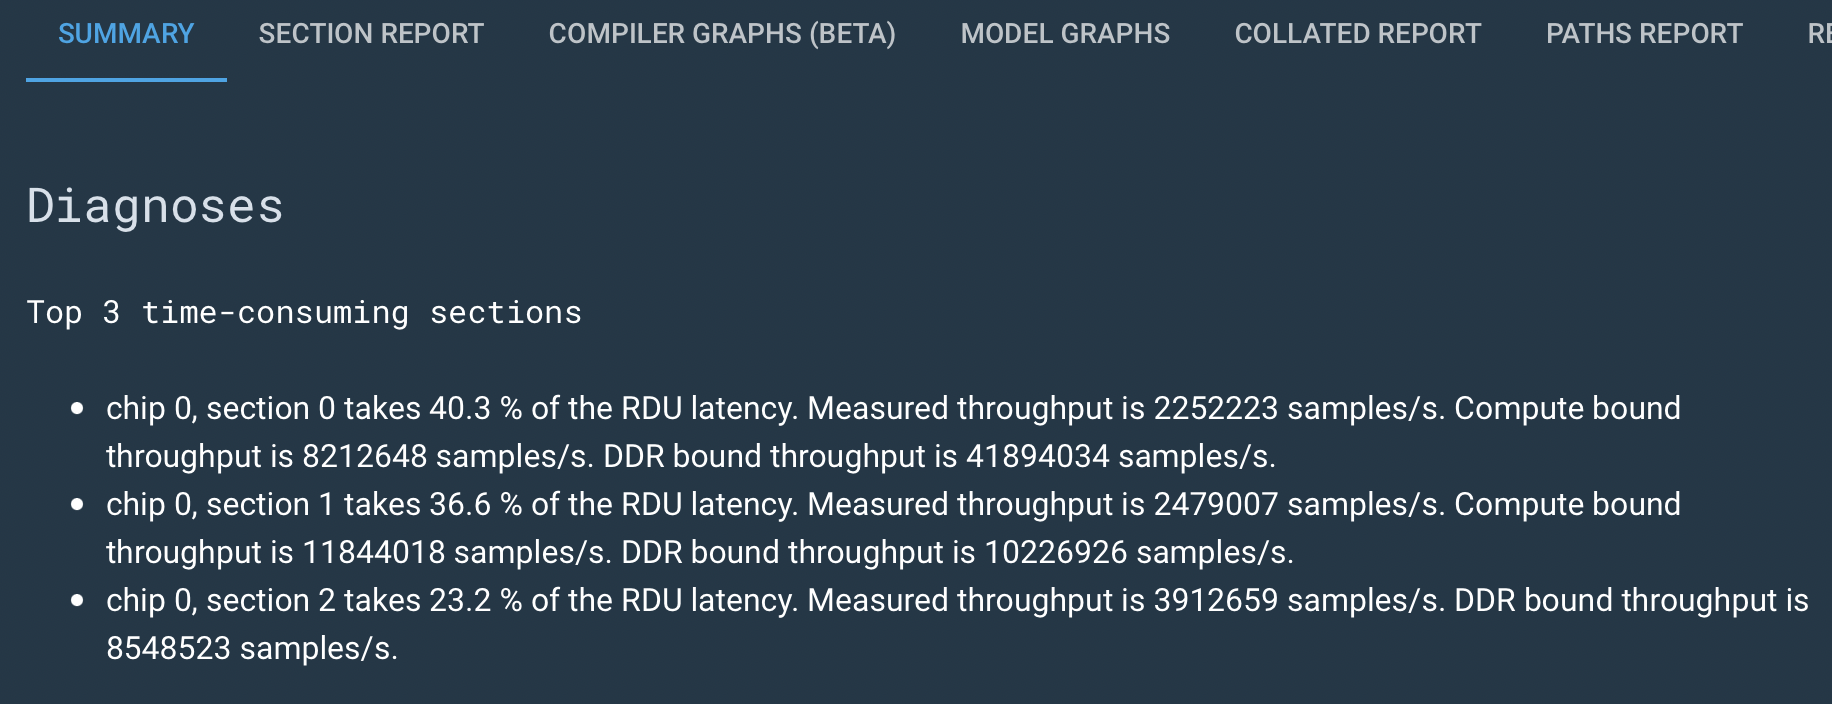
If the model is not host bound but RDU bound, click the RDU bar in the GUI. In the Summary tab, look first at the Diagnoses. |
|
3 |
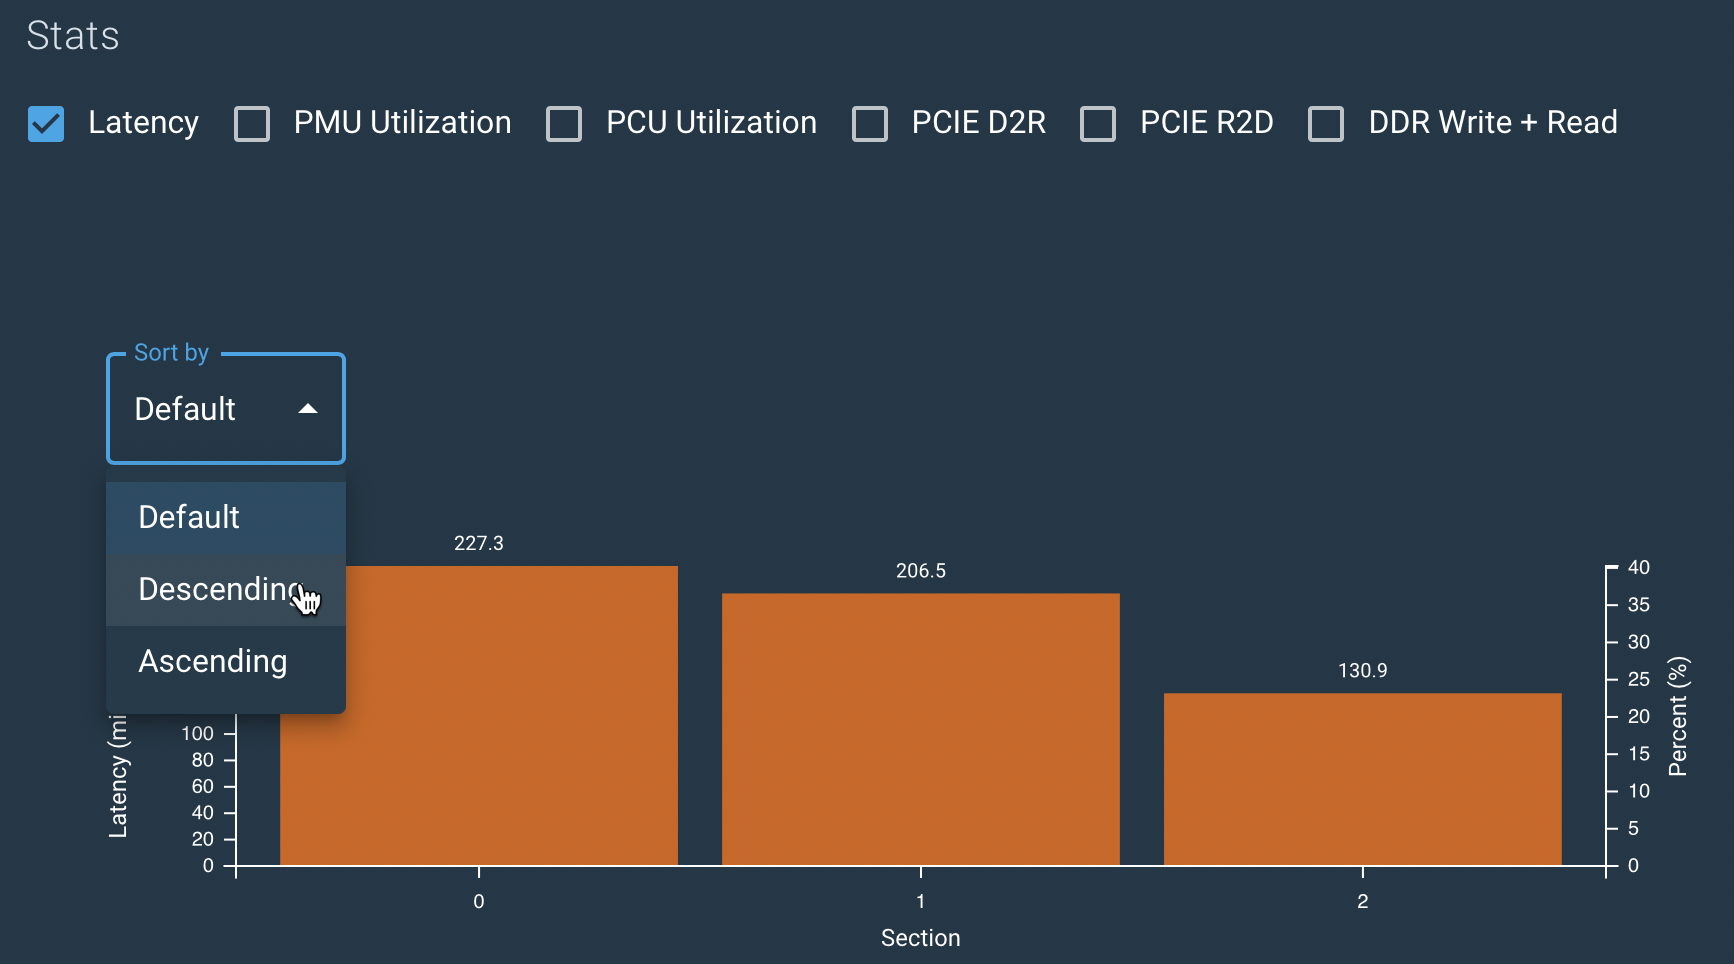
Next, scroll down to the Stats section. With Latency selected, sort the chart, and then click the bar for the section with the highest latency to drill down. See Examine section latencies for details. |
|
4 |
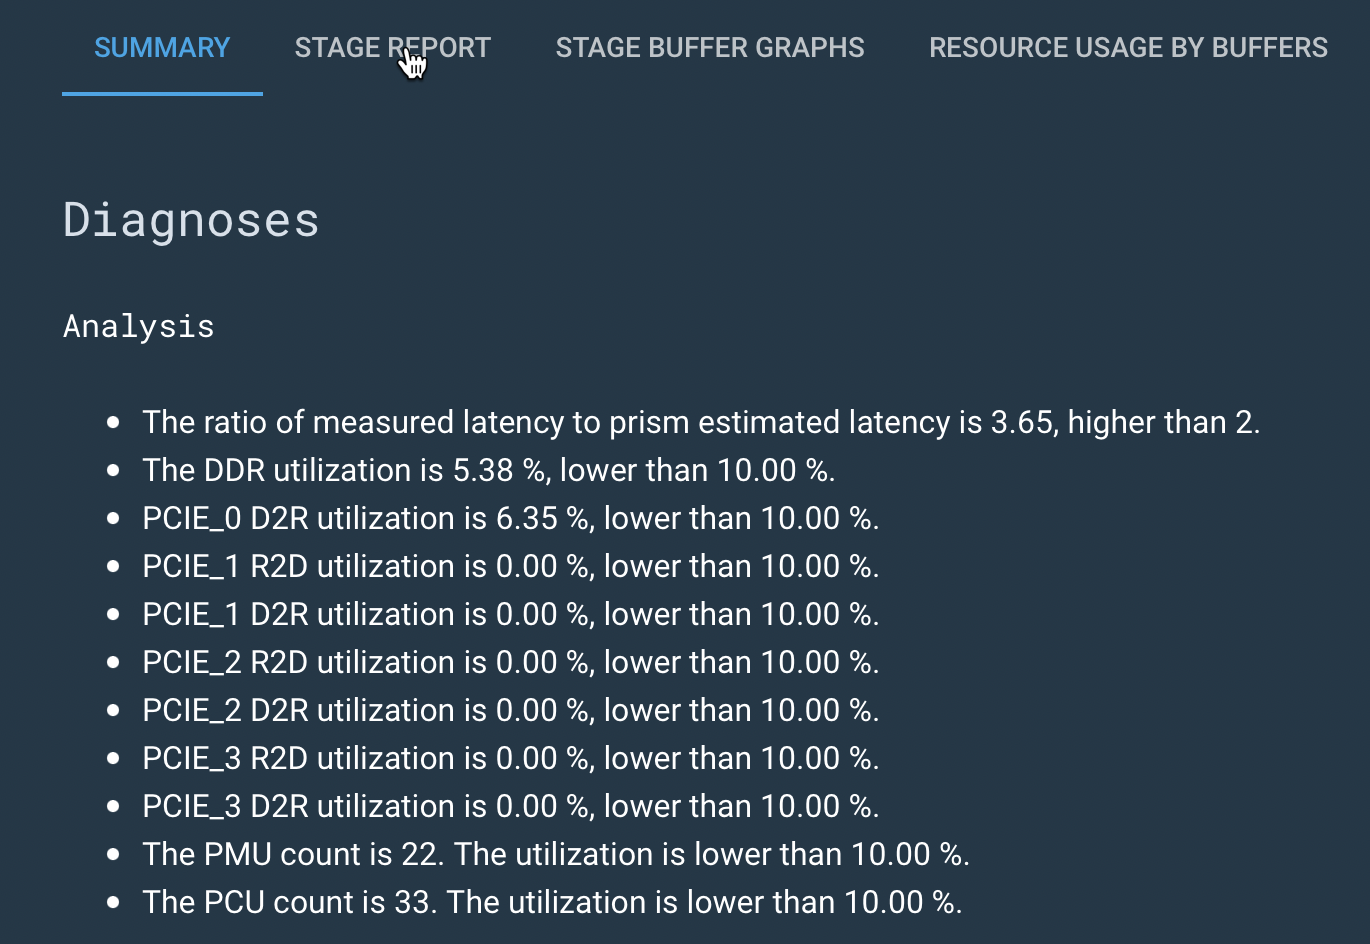
Start by examining the Diagnoses and Stats for that section. Click Stage Report to examine stages for the selected section. |
|
5 |
If the sections and stages seem balanced, click Overview again. |

|
6 |
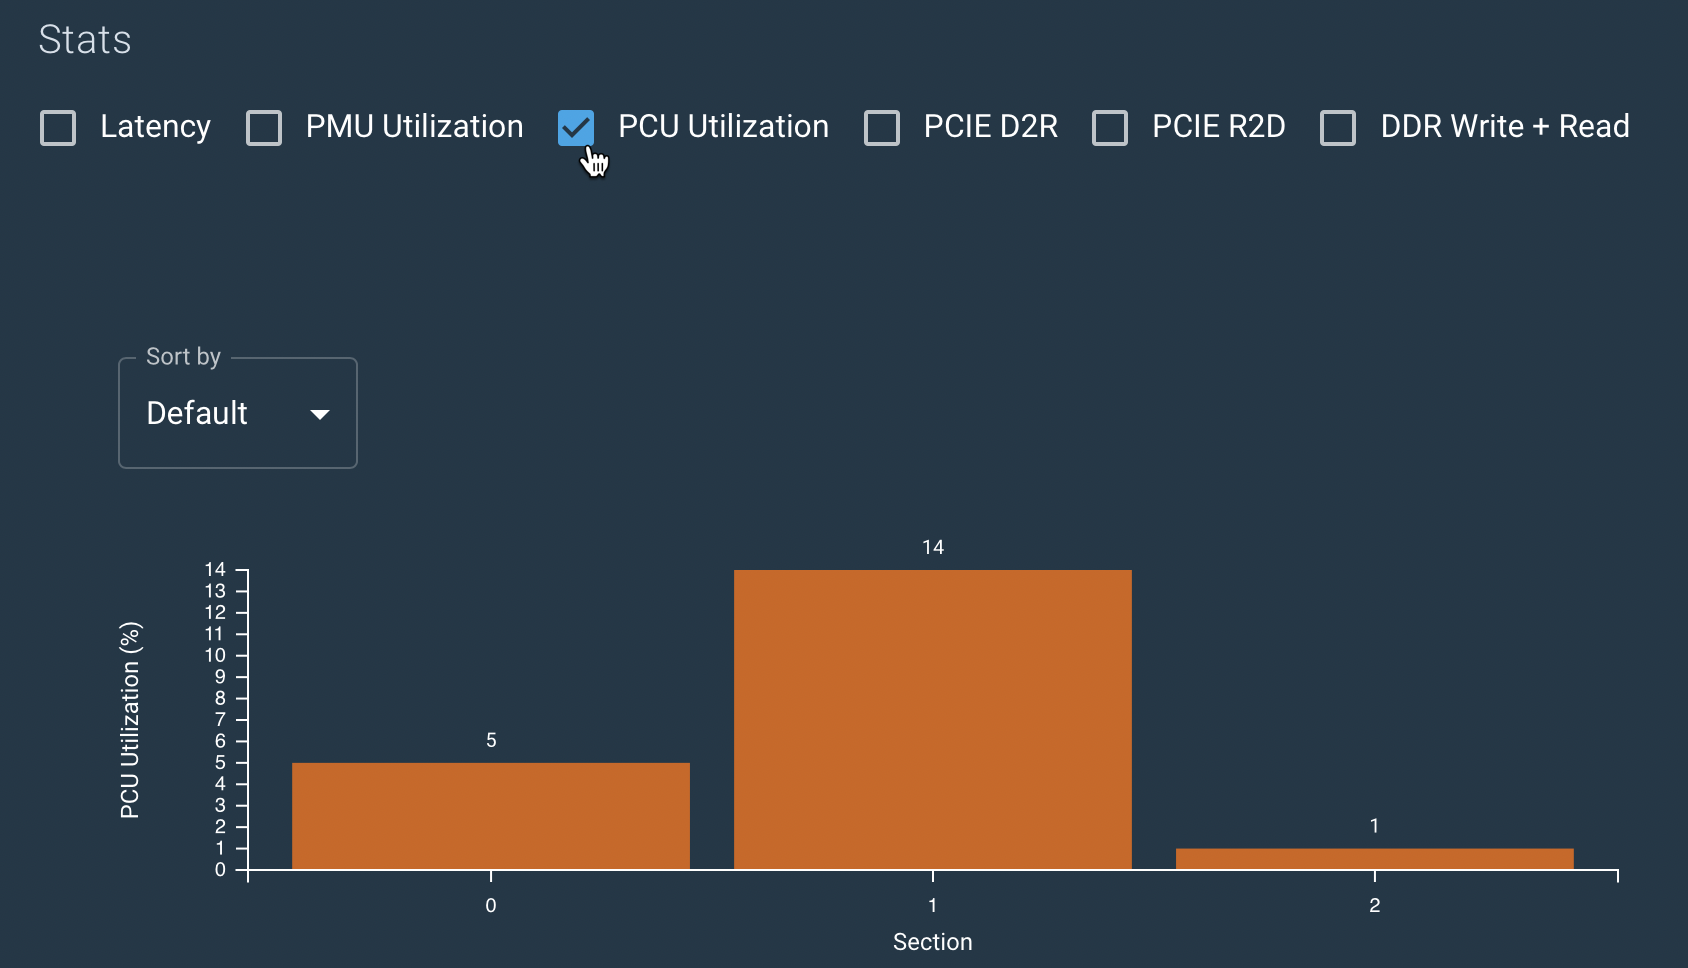
Then deselect the Latency check box and select the PCU Utilization check box to examine that aspect of your model run. See Make final checks for details of that stage of exploration. |
|
7 |
If your exploration hasn’t helped you understand how to improve performance and remove bottlenecks, constact your Customer Support representative. |
|
Optimize host-bound models
If you see in the Summary that the model is host bound, you can examine details and change some aspects of your model.
| If you can’t improve performance using the suggestions in this section, contact Customer Support for help. |

Here’s the detail you need:
| No. | Description | Screenshot |
|---|---|---|
1 |
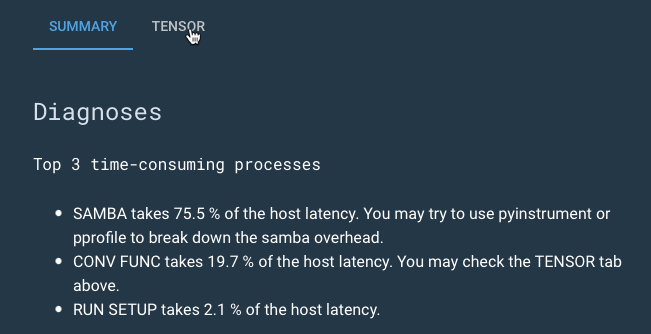
Select the model, select Analytics and click the Host bar in the Summary graph. Look at Diagnoses on the next screen to find out if the model spends a lot of time in the Conv function or if SAMBA is responsible for host latency. |
|
2 |
If the Conv function seems to be a bottleneck, click Overview at the top |

|
3 |
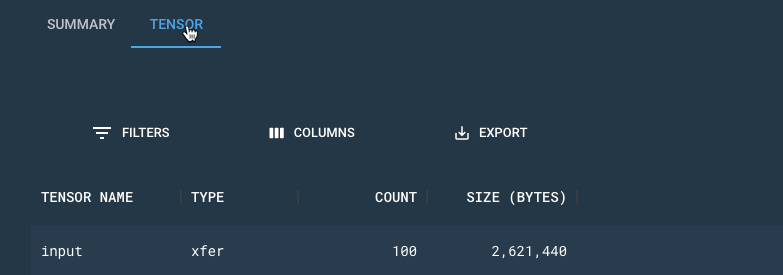
Click Host in the bar chart, and select the Tensor tab. |
|
4 |
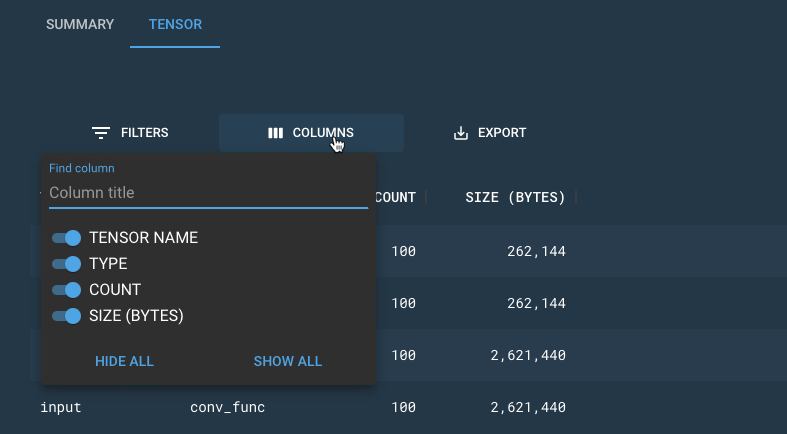
In the Tensor tab, explore the column to examine the tensors. Experiment with changes to your Python code to improves bottlenecks that are caused by tensors. |
|
5 |
If the Diagnoses show that the model is data transfer bound, you might also have to modify your Python code to reduce the number of output tensors. |

|
6 |
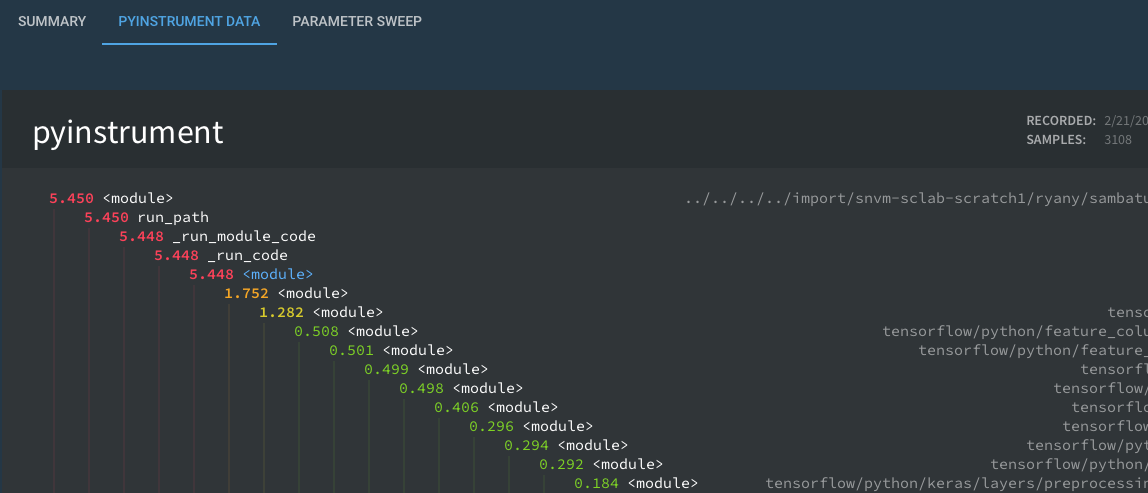
If SAMBA takes a lot of the time, then click Overview at the top and then click the Pyinstrument data tab. Look at the information and optimize your code to improve performance. |
|
7 |
If your exploration shows ways to improve model performance, make the changes and compile and run again, then run SambaTune over the revised model. |
|
Examine section latencies
If your model isn’t host bound, the next step is to look at potential bottlenecks on the RDU. The first step is to examine section latencies.

Here’s the detail you need:
| No. | Description | Screenshot |
|---|---|---|
1 |
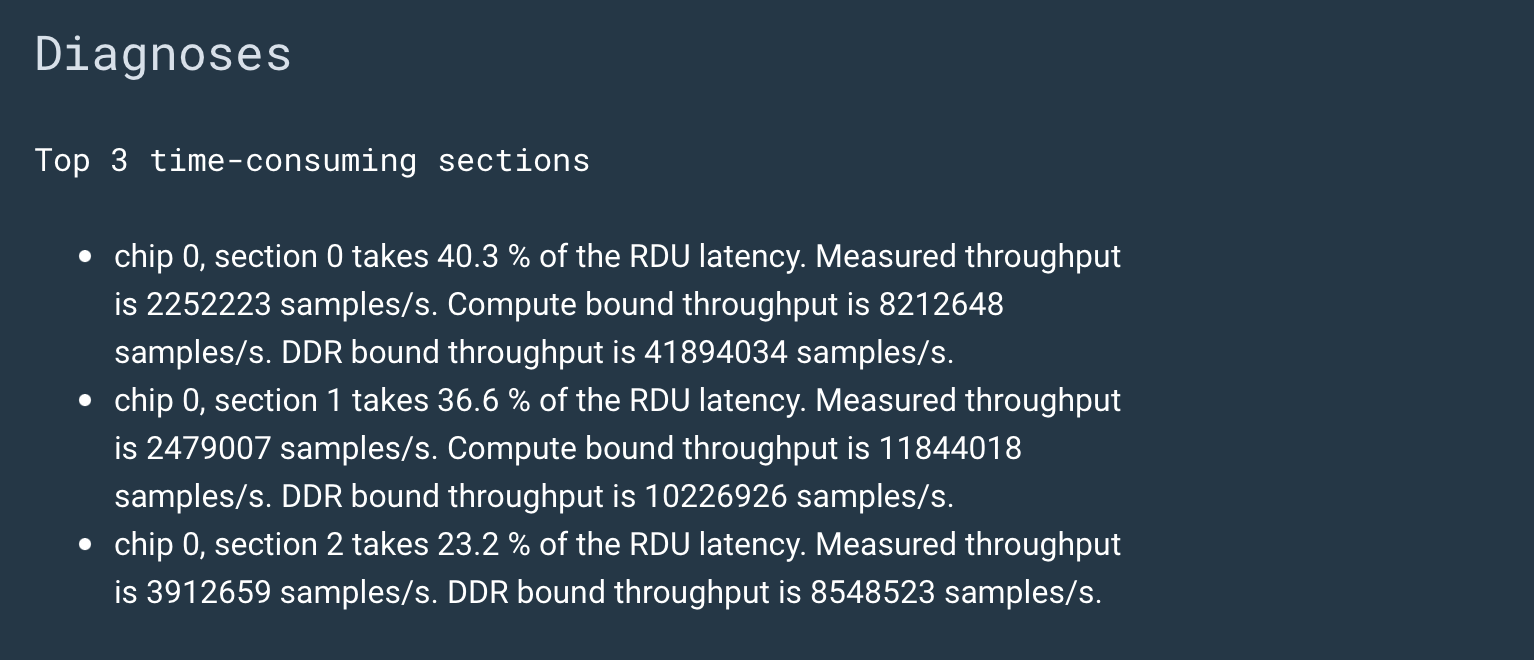
Select the model, select Analytics and click the RDU bar in the Summary graph. Look at Diagnoses on the next screen and examine the list of time-consuming sections there. |
|
2 |
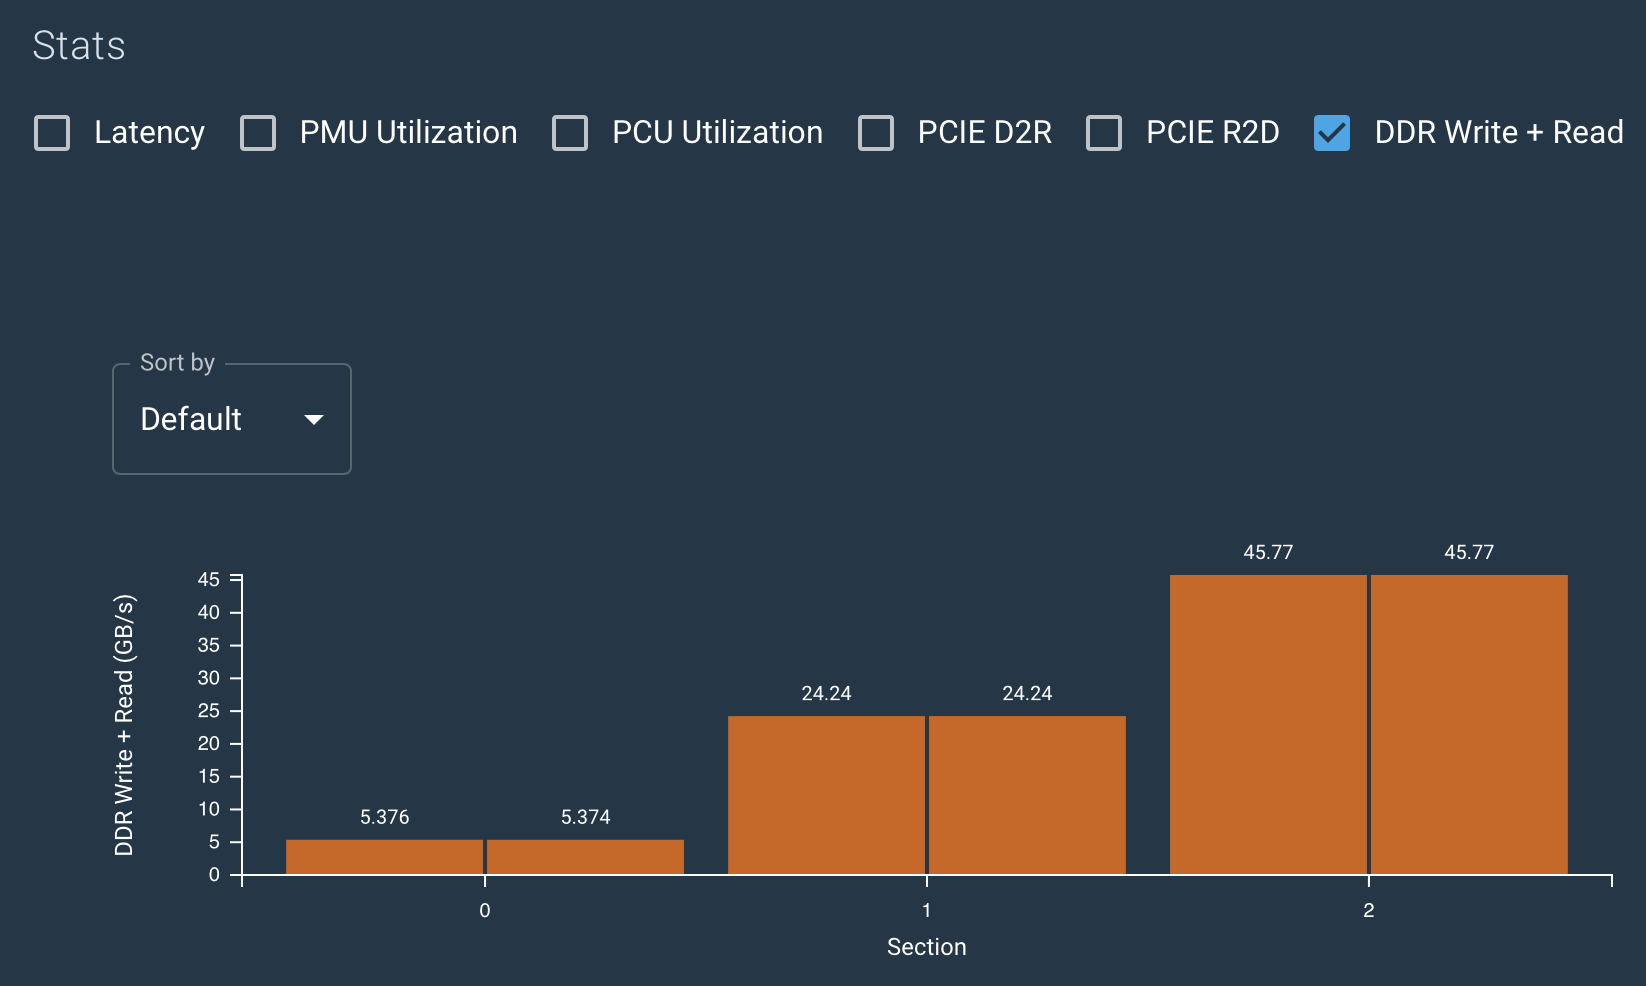
The diagram below, select DDR Write + Read and deselect Latency to examine DDR. |
|
3 |
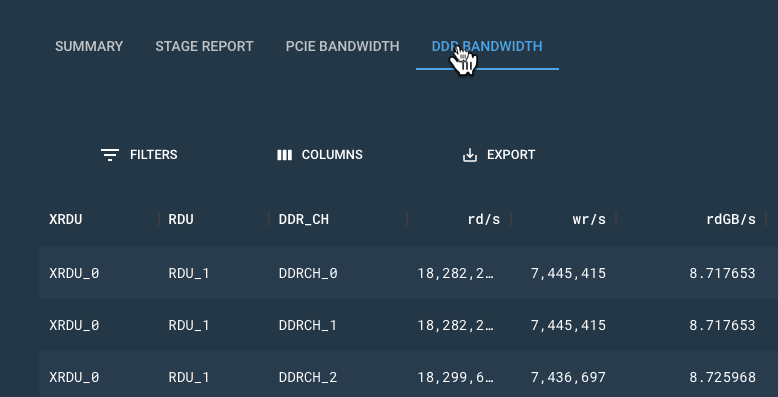
Next, click the tallest bar chart and then click DDR Bandwidth for more info on potential bandwidth problems. |
|
Make final checks
As a final check for performance improvement, you can look at the stage latencies and PCU utilization.
| For background on stage latencies, see Stage latency report. |

Here’s the detail you need:
| No. | Description | Screenshot |
|---|---|---|
1 |
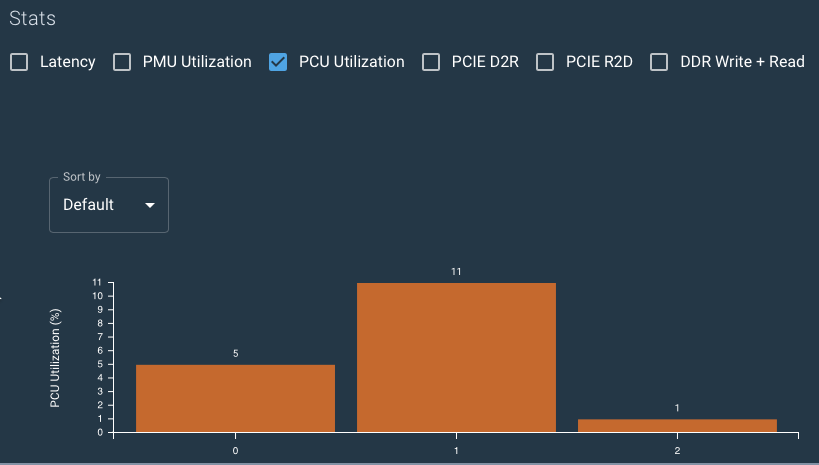
Start with the Overview, select PCU Utilization. If you see a section that has a PCU utilization that’s greater than 90%, you’ve found a potential problem. Otherwise, click the tallest section to drill down. |
|
2 |
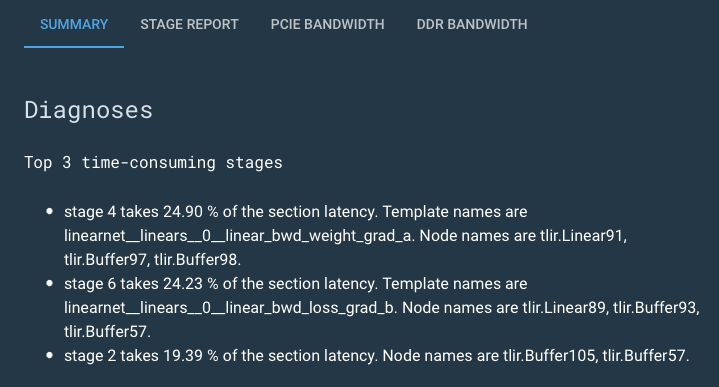
In the Summary for the section, you learn about the latency for each stage in that section. |
|
3 |
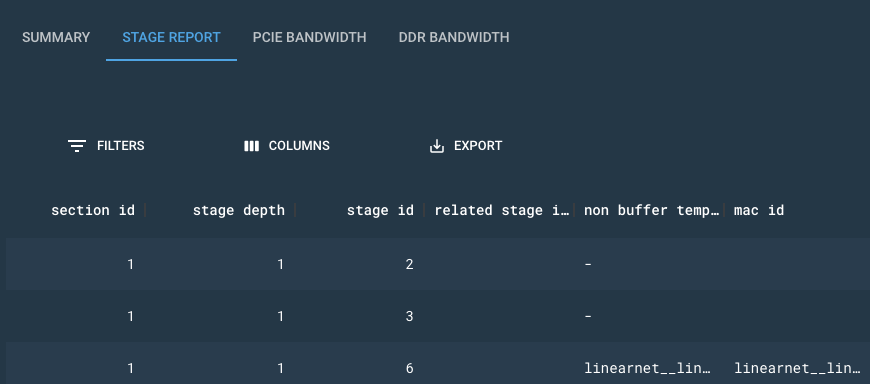
Finally, select the Stage Report tab and drill down into each stage. |
|
4 |
We expect that your exploration will be iterative, and that you might return to earlier explorations after making changes to your code. |
|