Explore analytics with SambaTune
After you’ve installed and run SambaTune, you can look at information about the model run, and then drill down into analytics.
Prerequisites
-
Ensure that SambaTune is installed in your environment. See Install SambaTune
-
Run
sambatune, passing in your custom YAML file for the model you want to tune. See Run SambaTune. -
Run
sambatune_uiand note down the URL, username and password that you see at the end of the run. A random password is generated for each run. See Run the SambaTune GUI.
Procedure
-
From your web browser, connect to the SambaTune client. You use the information that you saw when you ran
sambatune_ui. -
In the Dashboard, either use the selected directory or specify a different directory.
-
Select one of the subdirectories by clicking the checkbox and click View.
-
Click Analytics on the left.

-
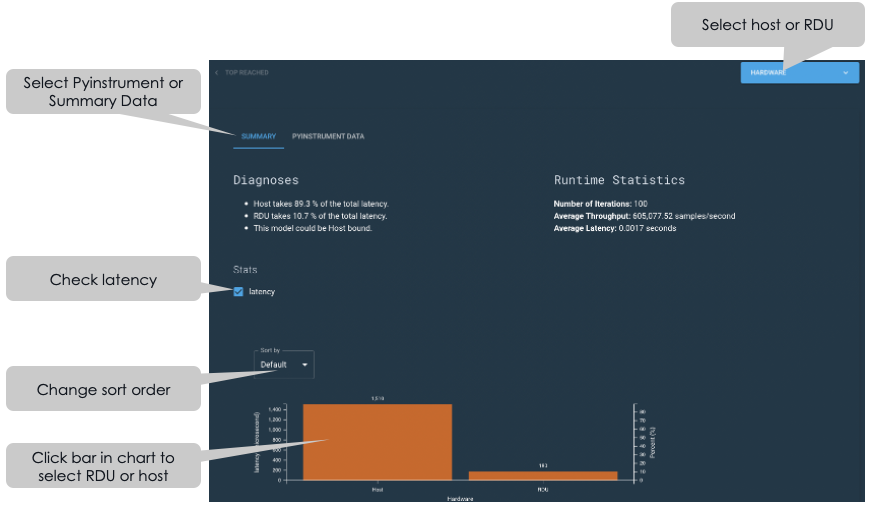
With Host selected, explore performance on the host.

-
Examine the Diagnoses and Runtime statistics. See Performance Insight Report for details.
-
With latency selected, you get a summary of the information in the Host-Device Breakdown.
-
Change the sort order as needed.
-
Explore the Pyinstrument data.
-
-
Click RDU in the bar chart to learn more about performance on RDU. The different tabs allow detailed insight into different aspects of performance on RDU.
-
You can investigate the information one section at a time.
-
Select the check boxes to learn more.
Check box Description PMU Utilization
Pattern Memory Unit utilization. For background information, see Accelerated Computing with a Reconfigurable Dataflow Architecture
PCU Utilization
Pattern Compute Unit utilization. For background information, see Accelerated Computing with a Reconfigurable Dataflow Architecture
PCIE D2R
Peripheral Component Interconnect Express connectivity.
PCIE R2D
Peripheral Component Interconnect Express connectivity.
DDR Write + Read
Dynamic random-access memory information.
-
The Training/Inference Statistics tab is currently in Beta. Expect updates in a future release.
What to do next
-
Look at the workflow example, which includes screenshots.
-
You can compare analytics for two comparable model runs. See Compare performance metrics.