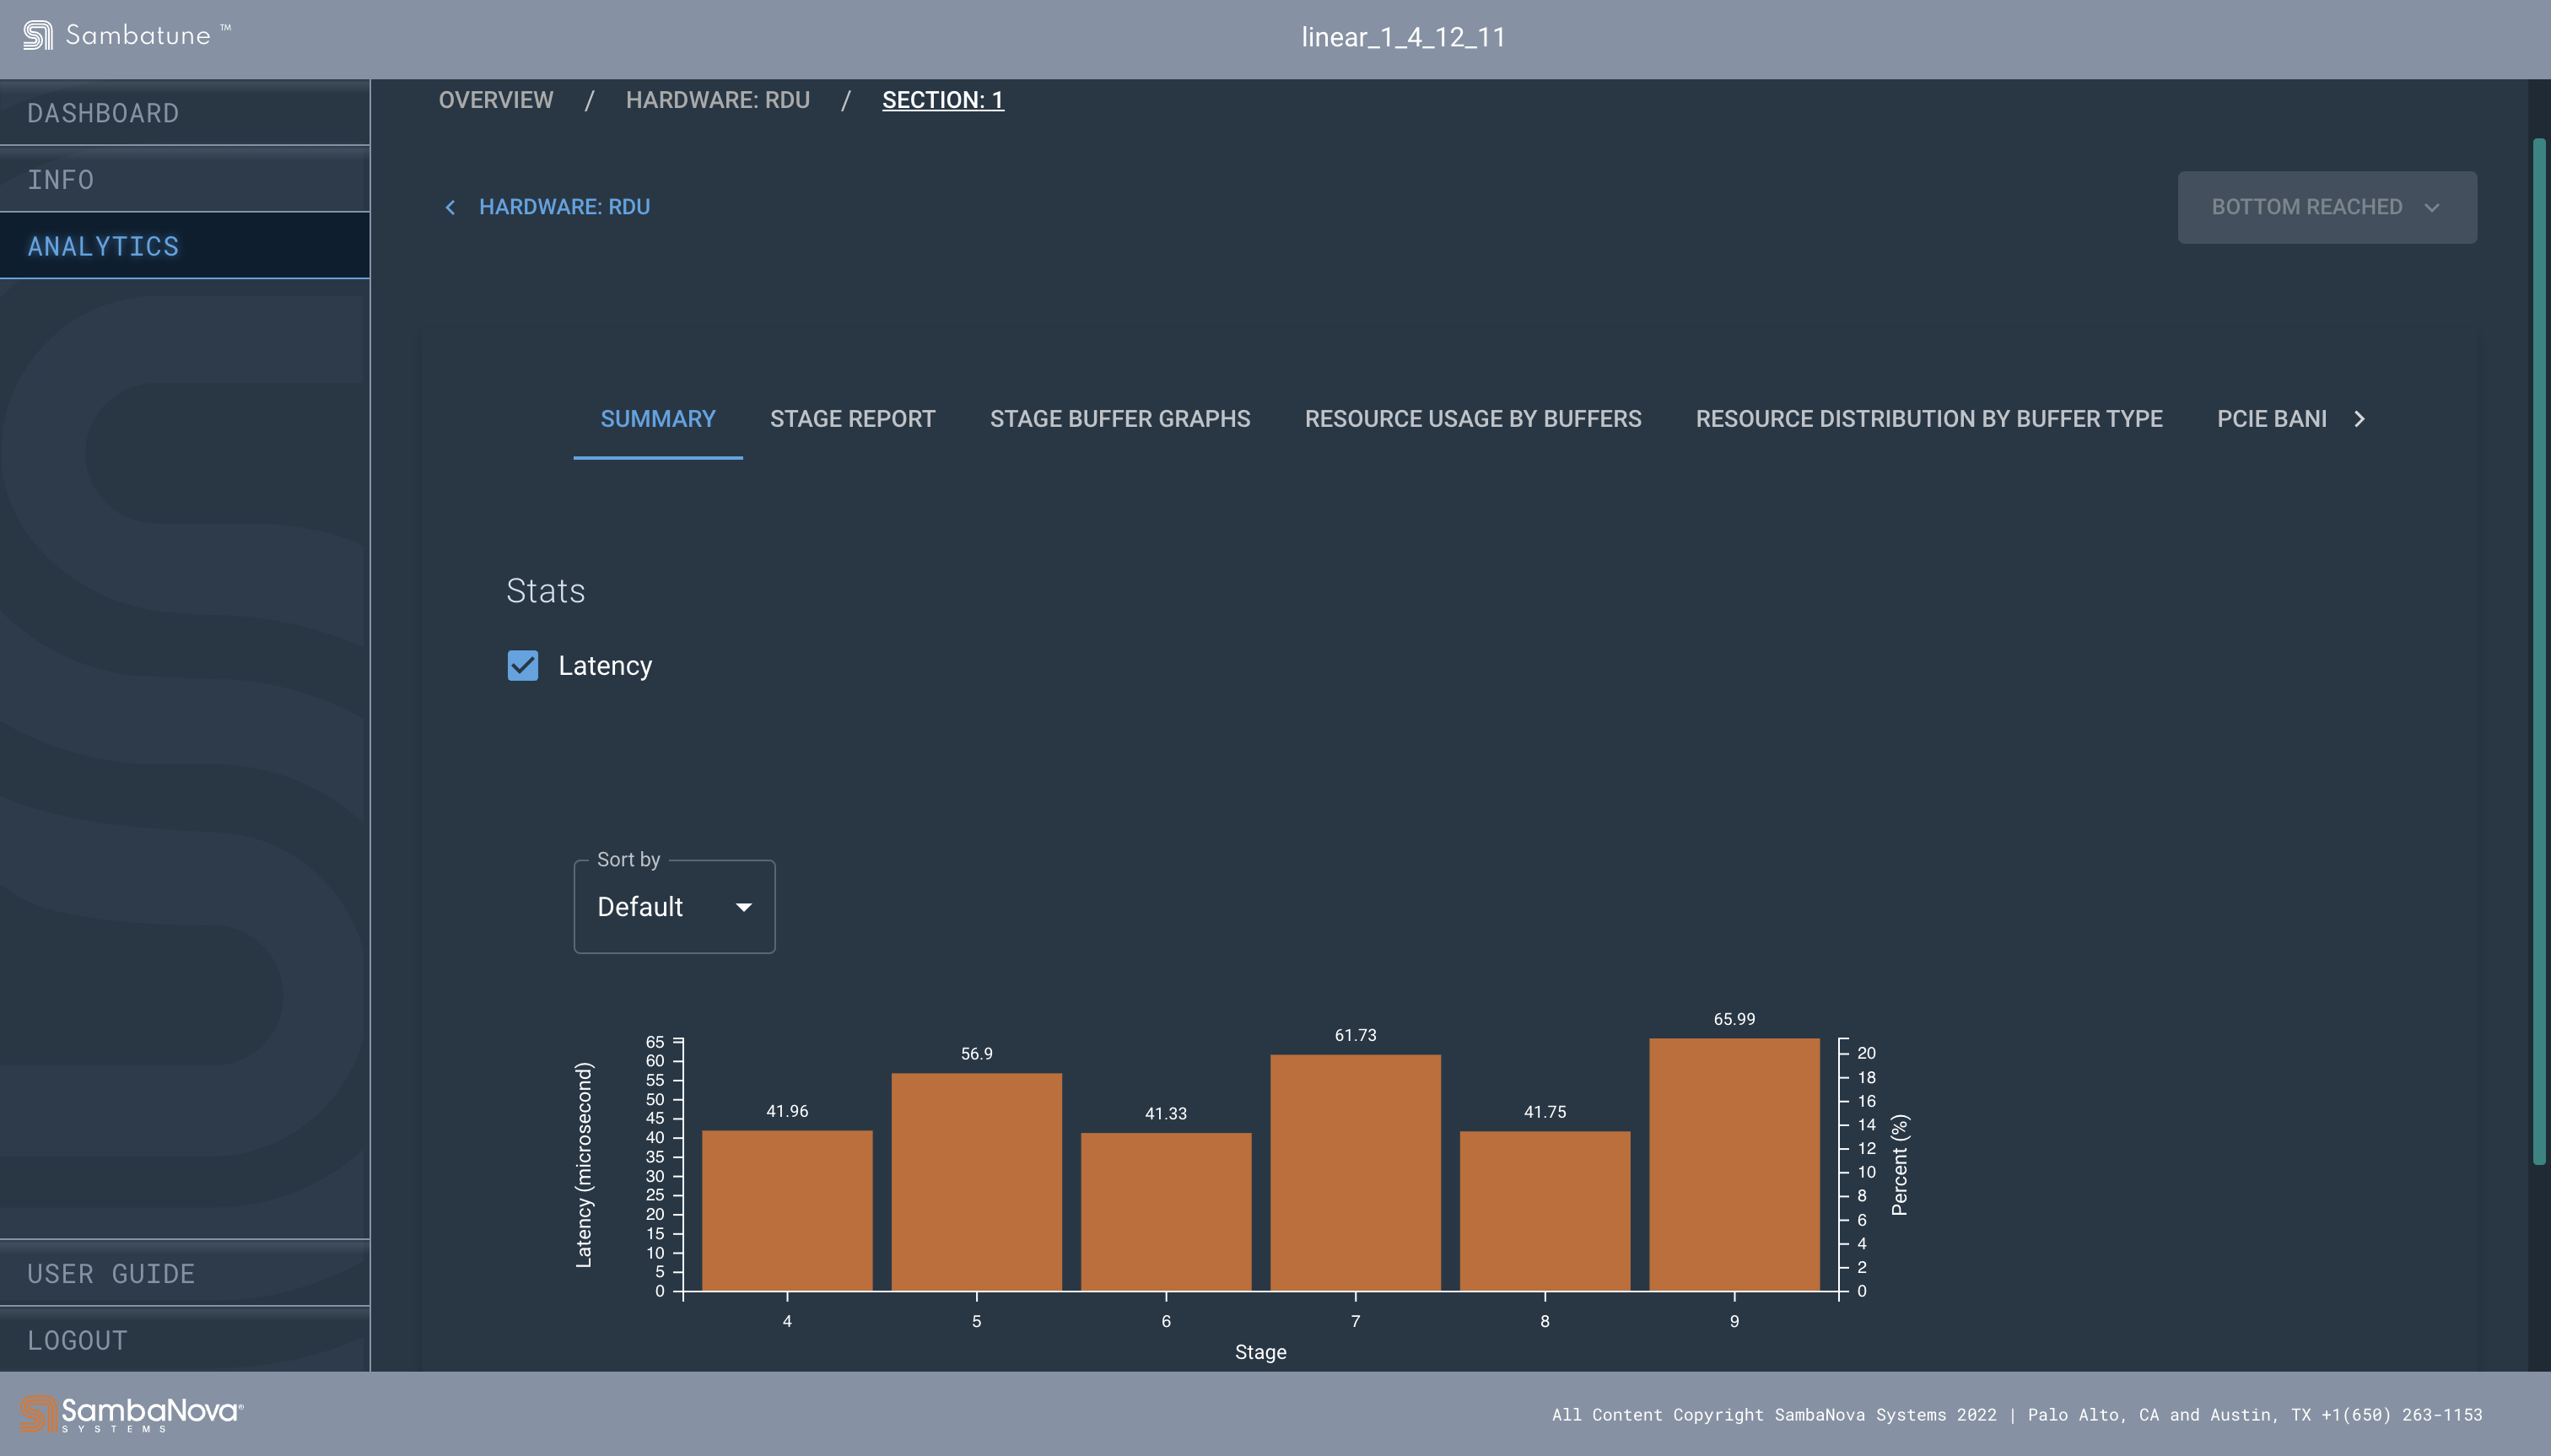
Stage latency report
A section is split into stages. This report provides per-stage diagnostics - it lists the time taken by each stage. A stage is often the equivalent of an ML graph operator, but not always so. A stage may be an intermediate buffer inserted by the compiler mid-end or backend, or multiple operators may be fused into one stage. Stages execute as a pipeline, and therefore, the longest latency stage is often the critical stage.
The stage latency report can help you identify bottlenecks at the stage level and you can check slowest stages in a section.

Find the report
The report is available:
-
In .XLSX format at
/reports/collated_report.xslxin your output folder in the 'Stage Latency' worksheet. See View the tabular report. -
As a standalone CSV at
reports/stage_report.csvin your output folder.
Read the output data
The report returns the following information.
| Column Name | Description |
|---|---|
section id |
Unique ID associated with each section. |
stage depth |
Number of stages between this stage and the start of the section. |
stage id |
Unique id associated with each stage. If set to -1, this row either represents a inter-stage buffer that is not assigned a stage_id, or a bug/oversight in the stage_id assignment code. |
related stage ids |
Related stage ids are displayed if the stage id is set to -1, or any stage latency counter associated with a stage has a different stage id. |
non-buffer template names |
List of all templates in the stage that are not buffers. |
mac id |
List of mac ids associated with the stage template information. |
nodes (kNames) |
The kNames (the name at the lower stack) for each of the templates in the stage (including buffers). |
nodes (NodeName) |
Node names (the name at the lower stack) for each of the templates in the stage (including buffers). |
measured latency |
Measured latency (in cycles) of a stage, based on the reading of the instrumentation counters divided by the number of iterations. |
all measured latencies |
If there’s more than one instrumentation counter with the same stage id, the report buckets those counters together and reports only the counter with the lowest measured stage latency in the |
tile id |
Unique ID associated with each tile. |
chip id |
Unique ID associated with each chip. |
event name |
Event name associated the instrumentation counter |
in → out buffers |
List of all input buffers in the stage |
Interpret the data
The stage latency bar charts can be helpful in identifying the longest stage, which is often, though not always, the critical stage in the section. You can then troubleshoot bottlenecks.
This section will have more information in a future release.
View the XLSX report
When you view the report, you can select the tabs at the bottom to drill down. Pay attention to the color coding:
-
The row will be formatted orange if stage-id is missing. Stage-id is said to missing if its value is -1.
-
If measured latency is within 10% of critical latency, measured latency cell is formatted yellow. Critical latency formula is:
(rdu_clock_speed * microbatch_size) / section_throughput
View the tabular report
The tabular form of the stage latencies allows you to sort, search and filter aspects of stage latency. For example, you can sort the latencies in descending order or look for stages with latencies greater than a certain threshold value. Here’s a screenshot of an example in the GUI client.
