Monitor and debug the DataScale SN30 rack
The DataScale® SN30 rack supports standard methods to monitor and triage the system. This page includes some tasks you can perform, such as examining log files, and also explains how collect diagnostic information for use with SambaNova support.
1. Overview of tools and logs
Several tools and logs can help you resolve problems. Here’s an overview:
| Task | Tool | See |
|---|---|---|
Check the status of the DataScale SN30-2 RDU module |
xrdutool |
|
Configure SNMP alerts for third-party rack components. |
SNMP alerts |
|
Diagnose problems with logs. |
OS logs, BMC logs, compiler logs, application logs |
|
Check and manage SND, view SND logs. |
SND (SambaNova Daemon) |
|
Debug model compilation, running models, and third-party components |
Misc. tools and logs |
If you cannot resolve the issues yourself, create a support case and include diagnostic materials. See View SN30-H BMC diagnostic information and logs.
2. View xrdutool diagnostics and logs
You use the xrdutool tool and logs to diagnose a DataScale SN30-2 issue
and to collect information for SambaNova Support to triage an issue.
The tool gets the status of the DataScale SN30-2 RDU module that the tool is run on.
Use the tool to check the overall status of the DataScale SN30-2 RDU module and of the hosted RDUs and memory. Follow these steps to examine the output on the power and fault status of the DataScale SN30-2 board:
-
Log in to the DataScale SN30-2 RDU module’s BMC that is having problems:
$ ssh root@<BMC_IP_Address> Password: <Enter root password> -
Run the
xrdutoolcommand:root@xrdu:~# xrdutool status -
Examine the output, which gives a quick view into the state of the DataScale SN30-2 RDU module along with two RDUs and the RDU controller. The output:
-
Shows whether any faults have been detected.
-
Shows the power state of the DataScale SN30-2 RDU module and of the RDU.
-
Here’s an example:
Power is on
RDU-C Release Version: 4.4.0
RDU-C BuildDate: 10.17 1654   DesignVer: 69   BoardID: 60
XRDU_0: STATUS
--------------------------------------------------------
SYSTEM :  rdu3    rdu2    rdu1    rdu0    stby    ps      pex0    pex1    sys     p3v3        mss_op_state   mss_log_level
           1       1       1       1       1       1       1       1       1       1               4               1
--------------------------------------------------------
RDU_0/D_0  0935a00001f1d6a4 102007b367359895     RDU_0/D_1  09a6c000012eda24 605007b367359895     ON. Please verify rdu_pwr_status[0] value to determine faults
--------------------------------------------------------
ENABLES:  vddo    pvpp            pvdd    pvddq           pvtt            pavddh  pavdd   vddc
           1       1               1       1               1               1       1       1
PWRGOOD:  vddo    pvpp0   pvpp1   pvdd0    pvdd1  pvddq0  pvddq1  pvtt0   pvtt1   pavddh  pavdd   vddc0   vddc1   vddc2   vddc3
           1       1       1       1       1       1       1       1       1       1       1       1       1       1       1
--------------------------------------------------------
RDU_1/D_0  09e9a00001a5dc64 502807b367359895     RDU_1/D_1  08e8200000bedd24 107007b367359895     ON. Please verify rdu_pwr_status[1] value to determine faults
--------------------------------------------------------
ENABLES:  vddo    pvpp            pvdd    pvddq           pvtt            pavddh  pavdd   vddc
           1       1               1       1               1               1       1       1
PWRGOOD:  vddo    pvpp0   pvpp1   pvdd0    pvdd1  pvddq0  pvddq1  pvtt0   pvtt1   pavddh  pavdd   vddc0   vddc1   vddc2   vddc3
           1       1       1       1       1       1       1       1       1       1       1       1       1       1       1
--------------------------------------------------------
PEX_0:   fpga_p0v8_pex_pgd2   pg_p1v25_pex   pg_p1v8_pex_pll   fpga_pg_p1v8_pex
               1               1               1               1
--------------------------------------------------------
PEX_1:   fpga_p0v8_pex_pgd2   pg_p1v25_pex   pg_p1v8_pex_pll   fpga_pg_p1v8_pex
               1               1               1               1
--------------------------------------------------------
rduc_pwr_status[0] = 0x7fff
rduc_pwr_status[1] = 0x7fff
pex_pwr_status[0] = 0x7f
pex_pwr_status[1] = 0x7f
power_status_aggregate = 0x7fff
Board Type: 3
NUM_RDUS: 2
NUM_DIE_PER_RDU: 2
NUM_DIES: 4
In addition to collecting diagnostic information from the SN30-2 RDU module directly, you can get health status of all the SN30-2 RDU modules in the SN30-8 node by using the SambaNova Fault Management (SNFM) utility that comes pre-installed on the host. See the SambaNova Fault Management (SNFM) User Guide in the SambaNova Runtime documentation in the SambaNova documentation portal (https://docs.sambanova.ai).
For details on diagnosing a DataScale SN30-2 RDU module’s BMC and on collecting the required diagnostic and log material, see KB article #1024, "DataScale SN30-2 Diagnostic Collection", in the SambaNova Support portal.
3. Set up SNMP alerts
To configure SNMP alerts for non-SambaNova components in the DataScale SN30 rack, see the vendor-specific documentation.
4. Viewing system logs
You can use the following log files to identify and resolve issues with the system or an application:
-
OS logs
-
BMC logs
-
SambaNova compiler logs
-
Application logs
4.1. OS logs
SambaNova does not alter the logs or log directories for Red Hat Enterprise Linux or Ubuntu. The /var/log/ directory contains most of the logs and other log tools such as journalctl.
4.3. SambaNova compiler logs
Additional logs for the compilers are available in a user-specified directory that was specified at the time the models were compiled. These logs are fairly low level and are requested by SambaNova Support to troubleshoot issues. For details, see Collect diagnostic materials for SambaNova Support.
You can use different compiler log verbosity settings to debug issues. See the SambaFlow Runtime document for details.
4.4. Runtime logs
The following log files related to SambaNova are in the /var/log/sambaflow/runtime/ directory:
|
Logs related to SambaNova graph operations. Events received by the graph process and graph-specific events (including errors) that are not logged to |
|
SambaNova daemon (SND) system logs. Summary of RDU resources and hardware error events. |
Additional log events such as kernel logs (from the RDU driver module) go to dmesg(1).
| You can use different log verbosity settings to get more logging details for the SambaFlowTM Runtime and other SambaFlow components. See "Changing Runtime Log Levels" in the SambaNova Runtime Guide. |
5. SambaNova daemon (SND) diagnostics
The SambaNova daemon (SND) is running on the DataScale SN30-H host module and manages several critical pieces of the SambaNova operation. The SND is responsible for:
-
Loading and unloading the RDU drivers
-
Initializing RDU system resources
-
Managing hardware faults for the RDU system
-
Enabling the debugging of the RDU system’s hardware resources
The SND is required to run graphs and models because:
-
The SND handles the RDU drivers and the initialization of RDU resources.
-
The SND is aware of issues with RDU resources and can avoid problematic resources.
The SND starts automatically:
-
At boot time of the DataScale SN30-H OS and starts the discovery and initialization of the RDUs. This is why it is important to power on the DataScale SN30-2 RDU modules first, before powering on the SN30-H host module.
-
When the SambaFlow package is installed. In this case, the SND waits a few minutes after the installation for the RDU system discovery and initialization processes to complete.
5.1. Check SND status
To check the status of the SND, run the systemctl status snd command. Below is sample output showing what the command might return:
$ sudo systemctl status snd
● snd.service - SN Devices Service
     Loaded: loaded (/lib/systemd/system/snd.service; enabled; vendor preset: enabled)
    Drop-In: /etc/systemd/system/snd.service.d
             └─override.conf
     Active: active (running) since Wed 2022-10-19 07:10:10 PDT; 3h 24min ago
   Main PID: 5263 (snd)
      Tasks: 10 (limit: 629145)
     Memory: 164.9M
     CGroup: /system.slice/snd.service
             └─5263 /opt/sambaflow/bin/snd
5.2. Start, stop, and restart SND
You can start, stop, and restart the SND with the following commands:
To start the SND:
$ sudo systemctl start sndTo stop the SND:
$ sudo systemctl stop sndTo restart the SND:
$ sudo systemctl restart snd5.3. Use SND for debugging
The SND CLI provides physical visibility into the entire DataScale SN30-8 system. This allows complete access to the RDU system for debugging, triage, and validation efforts.
The SND is also responds to error events that occur on the RDU and on the entire DataScale SN30-2 RDU module.
All logs from the SND are written to /var/log/sambaflow/runtime/snd.log.
This log provides a summary of the RDU resources available to the system
and includes any hardware error events that occur.
The information is useful for diagnosing and resolving hardware issues.
6. Debugging DataScale SN30 issues
Troubleshooting might require that you debug issues with the following DataScale SN30 rack components:
-
Compilation of models
-
Running of models
-
Third-party components
7. Debug model compilation
For problems that occur while compiling models, run the following command and examine the logs that are generated in the user-specified output directory:
$ python <model_script.py> compile --output-folder=<output_directory>You can set different levels of logging verbosity when you compile a model. See Collect diagnostic materials for SambaNova Support for best practice when creating a support case.
7.1. Debug running models
For problems that occur while running models, use these resources:
-
The
/var/log/sambaflow/runtime/log filesThese logs provide an initial glance into an issue that is occurring while running a model. If a problem does occur and is reproducible, enable more logging verbosity for SambaFlow Runtime. See the "Changing Runtime Log Levels" section of the SambaNova Runtime Guide for details.
-
The SambaNova Fault Management (SNFM) tool
The SNFM tool provides a framework to
-
Monitor, log, and clear various faults associated with a DataScale SN30-2 RDU module
-
Provide corrective actions to recover from these faults.
This capability is built into the SambaNova daemon (SND) and installed as part of SambaFlow. See "SambaNova Fault Management (SNFM) User" in the SambaNova Runtime Guide for details.
7.2. Debug third-party components
For operational issues with the third-party components in the DataScale SN30 rack, see the vendor-specific documentation. For issues that require additional support or for questions related to troubleshooting, open a support case through SambaNova Support. See KB article #1017, "SambaNova Systems Support Best Practices," at https://support.sambanova.ai.
| Do not open a case directly with the product vendor. |
8. Collect diagnostic materials for SambaNova Support
When you open a support case, provide details on the issue that has occurred, and initial diagnostic materials. For collecting diagnostic materials, See the following KB articles in the SambaNova Support portal:
-
DataScale SN30-2 Diagnostic Collection: KB article #1024
-
DataScale SN30-H BMC Diagnostic Collection: KB article #1039
-
DataScale SN30-H (Red Hat Enterprise Linux) Diagnostic Collection: KB article #1039
-
DataScale SN30-H (Ubuntu) Diagnostic Collection: KB article #1039
-
Ethernet Data Switch Diagnostic Collection: KB Article #1053
-
Access Switch Diagnostic Collection: KB article #1053
-
Serial Console Server Diagnostic Collection: KB article #1121
-
PDU Diagnostic Collection: KB article #1120
9. View SN30-H BMC diagnostic information and logs
To quickly identify a system’s status and view diagnostic information and logs for the DataScale SN30-H BMC, follow these steps:
-
Log in to the BMC’s Web UI and view the BMC dashboard.
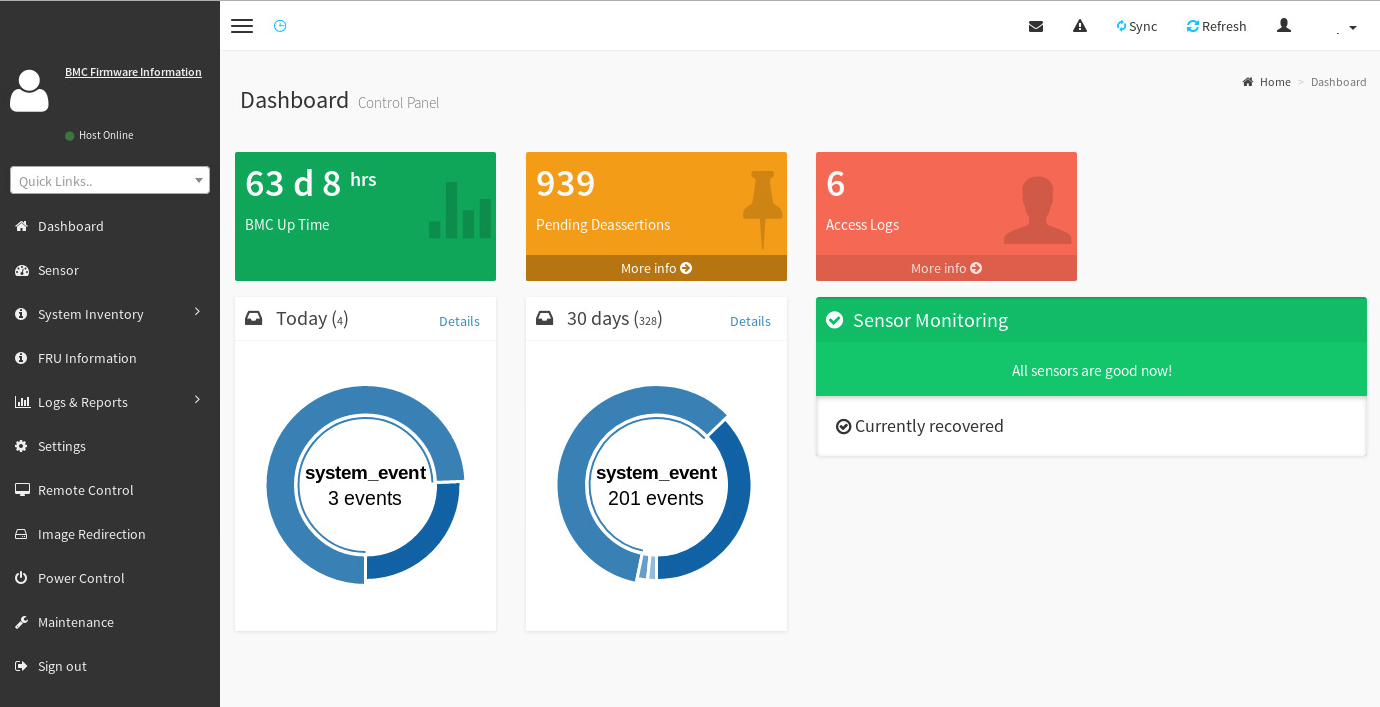
-
For details on logs and pending events/deassertions, click the More info link in each box.
-
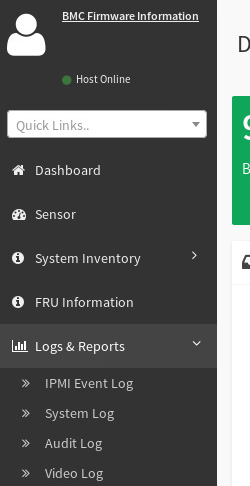
To find more logs and reports, click Logs & Reports in the left pane and select a log.
See KB article #1039, “Diagnostic Data Collection Tool(samba_diag),” in the SambaNova Support portal (https://support.sambanova.ai) for details on:
-
Diagnosing a DataScale SN30-H host module’s BMC
-
Diagnosing the DataScale SN30-H host module in general
-
Collecting the required diagnostic materials and logs.