Stack Tracing report
The Stack Tracing report supports tracing (or combining info from) a PyTorch operator or hyperfunction across different layers in the software stack so you can integrate information for the different layers with respect to a hypersection or section.
Hyperfunction and hypersection are related like this:
-
A hyperfunction is a user-defined reusable sub-graph that is defined explicitly with Python annotations, or implicitly if the user includes the o0/o1 compiler argument.
-
A hyperfunction is implemented with one or more hypersections. A hypersection is single instance of a repeating pattern. When the compile can reuse the hypersection multiple times, it can speed up the compilation significantly, especially in very large models that have many repeating patterns. (Currently, every instance of these repeating patterns is being compiled in isolation and treated as something new).
| Type | Source | Details |
|---|---|---|
Compiler Layer 1 |
Compile artifact |
|
Compiler Layer 2 |
Compile artifact |
|
Compiler Layer 3 |
Compile artifact |
|
Compiler Layer 4 |
Benchmarking report (per-section) |
|
Introduction of the layout
To access the layout, you have these options:
-
Clicking the Stack Tracing button on SambaTune UI (shown below).
-
Upload the json file with
_chrome_tracing_report.jsonas the suffix file to chrome:tracing

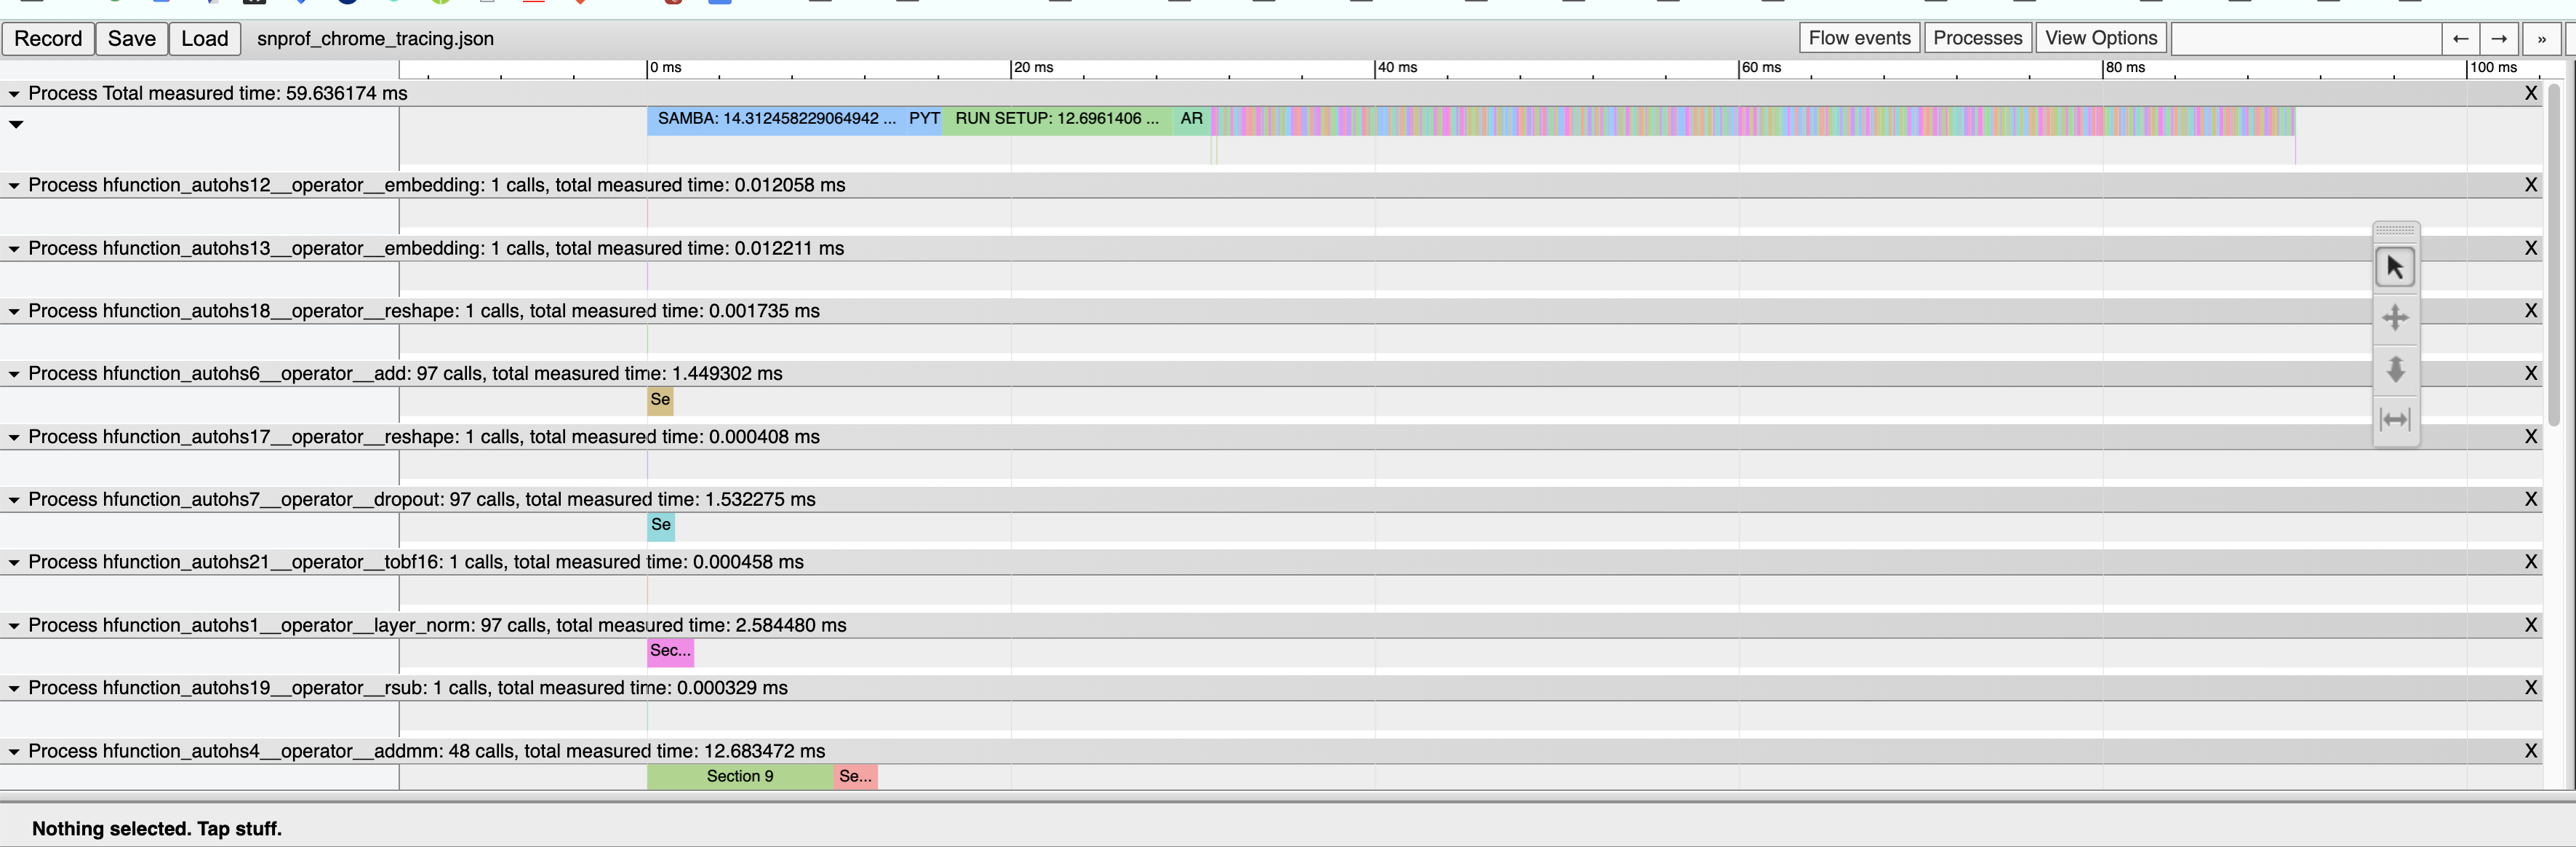
Here’s what the layout looks like:
-
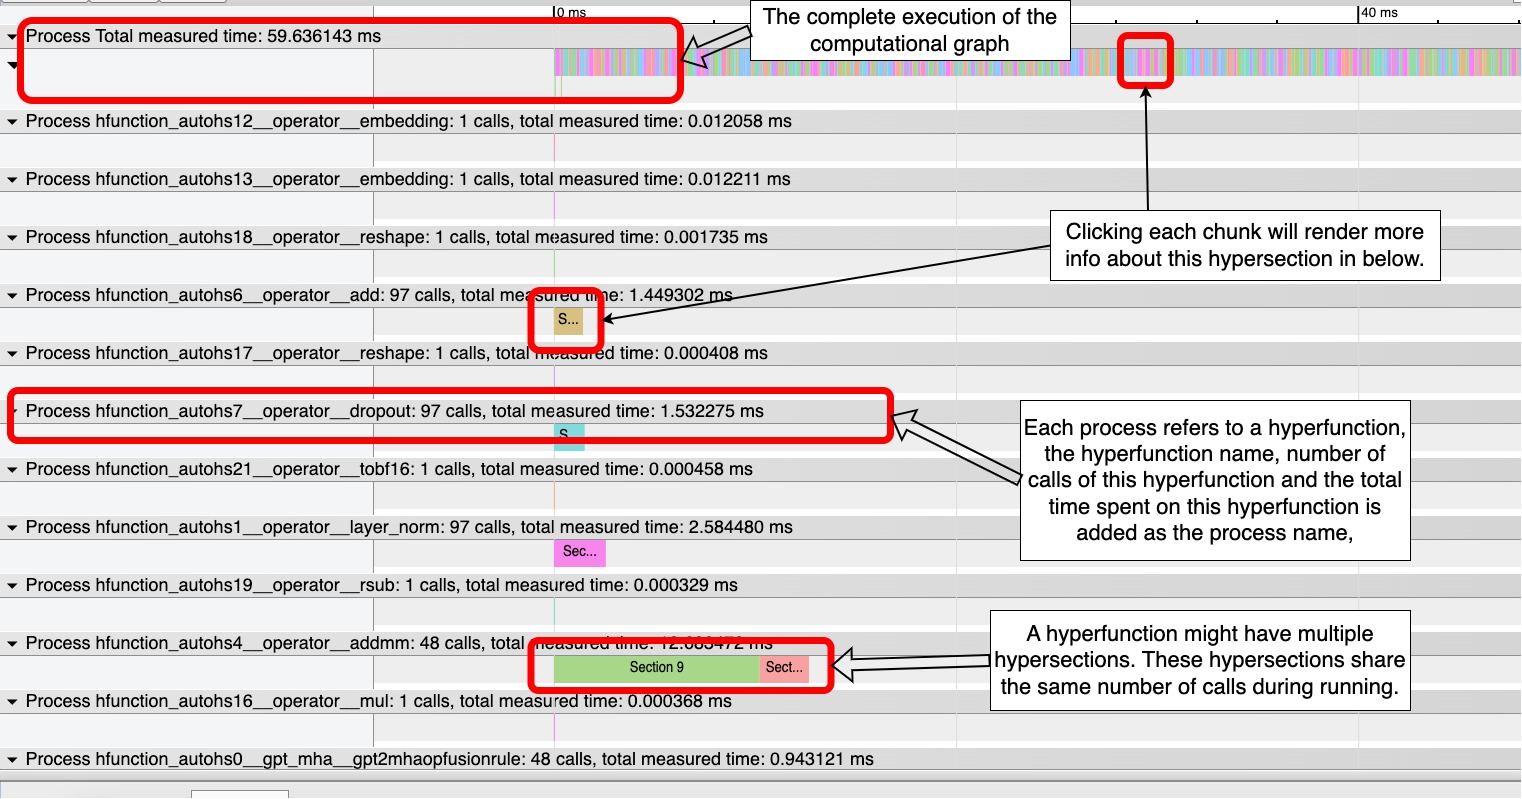
The top row refers to the running of the whole model. Each chunk refers to a section call.
-
The rows below show information for different hyperfunctions. Information includes the name of the hyperfunction, the number of section calls, and the amount of time for these section calls.
-
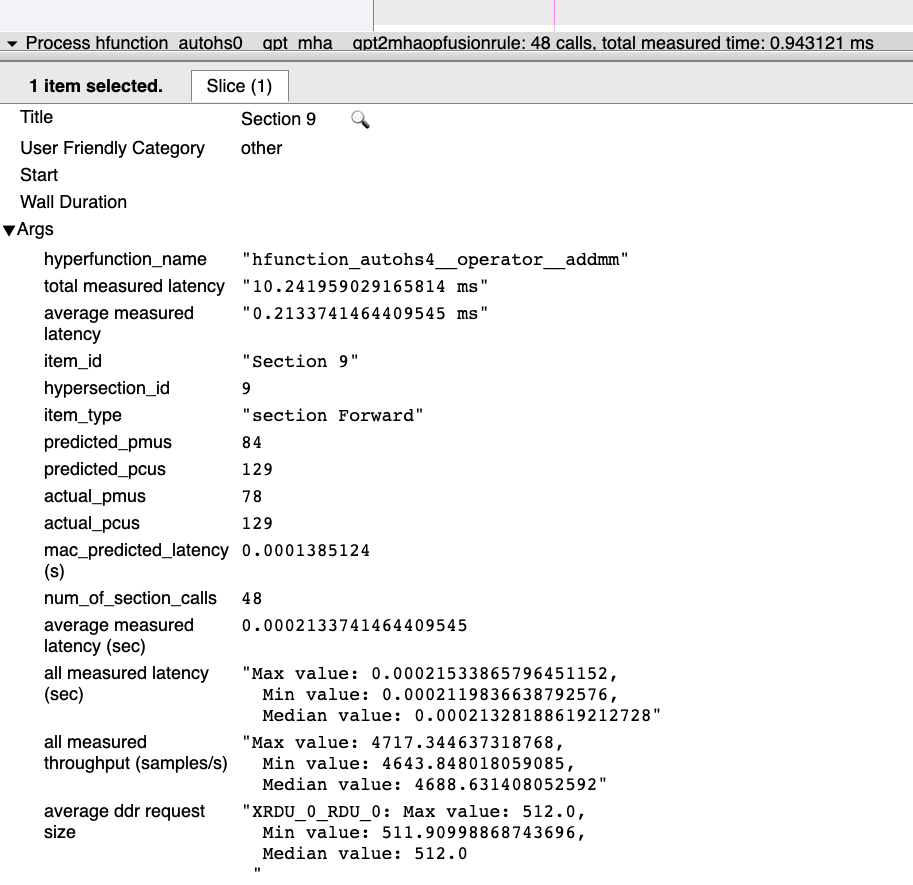
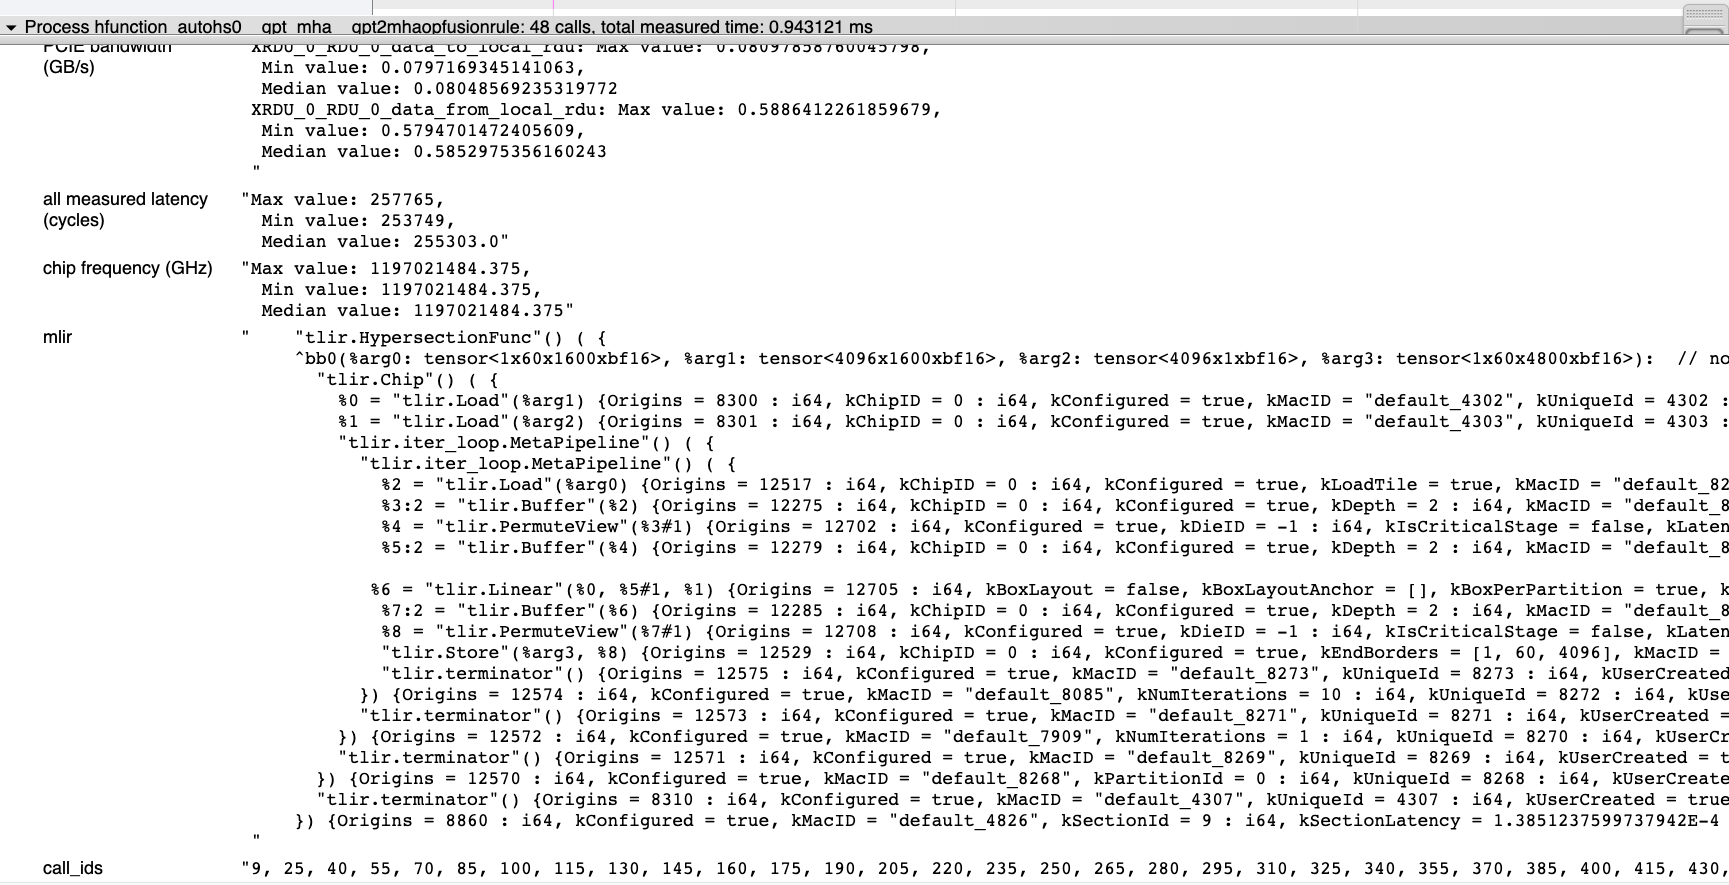
The different colors in each hyperfunction refer to different hypersections. Click a specific /section for more details (in the args).
-
For the case with snprof breakdown report, the top row includes times spent on SAMBA, PYTHON TO C, RUN SETUP etc.