Endpoint monitoring
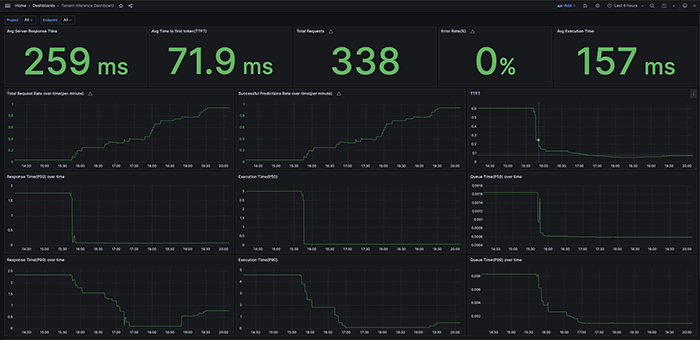
SambaStudio provides a monitoring dashboard (Grafana) that displays metric information for all endpoints in a selected Tenant. This allows you to monitor the performance of SambaStudio endpoints.
Open the Grafana dashboard
-
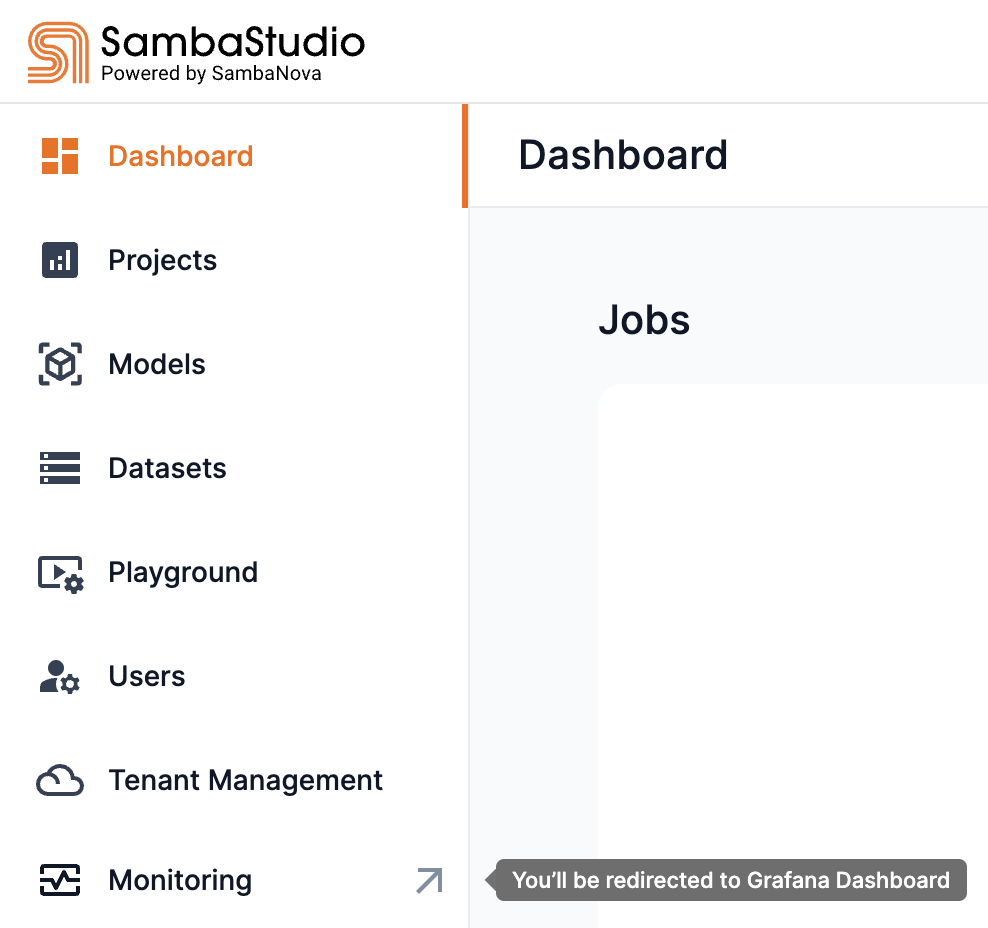
An organization administrator (OrgAdmin) or tenant administrator (TenantAdmin) can access the Grafana dashboard by clicking Monitoring in the left menu.
 Figure 1. Monitoring menu
 -
All user roles can access the Grafana dashboard from the following locations in SambaStudio:
-
The Endpoints table of the associated Project. Click the icon in the Monitoring column to open the dashboard for that endpoint.
 Figure 2. Endpoint monitoring from Endpoint table
 -
The Details section of an Endpoint window. Click the Monitoring link to open the dashboard.
 Figure 3. Endpoint monitoring link
-
Grafana dashboard
The Grafana dashboard will open in a new browser window. It displays information related to the selected tenant of SambaStudio.
You can use the drop-down Project and Endpoint filter options in the top bar to display corresponding information. From the right top drop-down, you can select a time range.
|
Please be aware of the following when interacting with the Grafana dashboard:
|
The table below provides an overview of several key metrics in the Grafana dashboard.
| Metric | Definition |
|---|---|
Response time (P50, 90, 95) |
The time, in seconds, spent receiving a request, generating the response, and returning a response to the user. For streaming models this is the total time until the final response is sent. For single output models, this is the time to return the response. Percentile 50, 90, and 95 values are available in the dashboard. |
Queue time (P50, 90, 95) |
The time, in seconds, spent in the queue before the request goes to the model. Percentile 50, 90, and 95 values are available in the dashboard. |
Execution time (P50, 90, 95) |
The time, in seconds, spent by the model generating the response. For streaming models, this is the total time until the final response is sent. For single output models, this is the time to return the response. Percentile 50, 90, and 95 values are available in the dashboard. |
Error rate |
The percentage of requests that result in an error. |
Time to first token (TTFT) |
The latency to the first token (including the queue time). Only available for stream API calls. |
Total successful predictions (per second, per minute, per day) |
The total number of predictions generated by the model. |
